Search...
What Are You Looking For?
Biomedical titanium alloys [1] serve as high-tech, economically valuable metallic materials for diagnosing and treating human tissues and organs. They are also widely used in repairing hard tissues such as bone trauma, artificial joints, and dental implants. However, current biomedical titanium alloys face numerous challenges during application. Among these, mitigating artifact issues [2] and maintaining mechanical properties represent critical problems requiring urgent solutions. Traditional simple titanium alloys exhibit significant performance limitations, making it difficult to overcome these constraints. Therefore, developing new alloy systems to meet biomedical demands is essential.
With the continuous advancement in metallurgy, high-entropy alloys (HEAs) have garnered significant attention from researchers due to their outstanding properties. Unlike conventional alloys, HEAs are not constrained by primary and secondary elements. They typically incorporate five or more metallic or non-metallic elements with near-equimolar ratios, resulting in relatively complex compositions. Consequently, they exhibit several effects distinct from traditional alloys. Yeh [3,4] summarized these into four key phenomena: the high-entropy effect, the hysteretic diffusion effect, the lattice distortion effect, and the cocktail effect.
During the research on high-entropy alloys, some researchers discovered that medium-entropy alloys (MEAs) also exhibit certain characteristics of high-entropy alloys. Typically, MEAs contain three or four primary elements. While maintaining excellent mechanical properties [5] and corrosion resistance [6], they offer higher specific strength and lower costs compared to HEAs. This makes them promising for applications in aerospace, automotive manufacturing, and biomedical fields [7].
In studies of novel titanium alloy systems, researchers have discovered that certain Ti-containing high/medium-entropy alloys exhibit favorable mechanical properties. For instance, Yuan et al. [8] successfully developed a medium-entropy TiZrNbTa alloy using non-toxic alloying elements, achieving a minimum elastic modulus of 57 GPa—nearly half that of conventional biomedical titanium alloys— with a maximum yield strength of 1050 MPa. This innovation has yielded novel biomedical materials characterized by low elastic modulus, excellent mechanical biocompatibility, and low magnetic susceptibility. Wang et al. [9] designed a high-entropy alloy system of TiZrTaNbSn with varying Sn content. They observed phase composition and microstructure while characterizing mechanical, corrosion, and wear properties. The alloy achieved a compressive strength of 999.2 MPa with plastic strain exceeding 49.9%.
Building upon the design principles of high/medium-entropy alloys, this study selected the “TiZrNb+” medium-entropy alloy system with potential biomedical research value as the research subject. Alloying elements were added to design medium-entropy alloys with varying compositions. The properties of medium-entropy alloys with different Sn addition ratios were analyzed to identify the alloy system with superior performance.
1 Experiment
1.1 Specimen Preparation
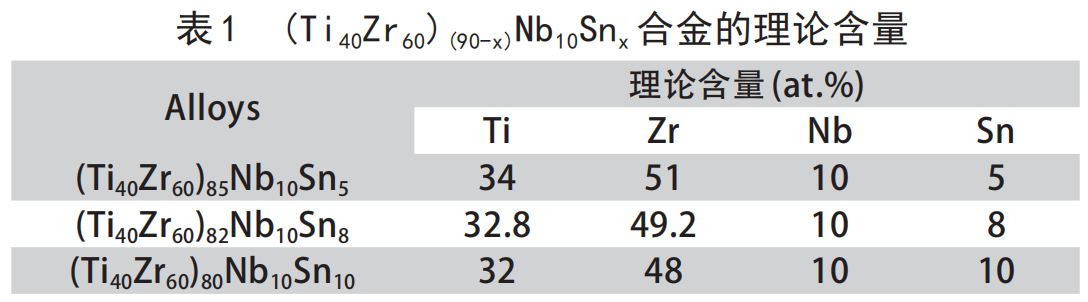
Titanium sponge, zirconium sponge, and niobium particles, all with a purity of 99.9% or higher, as raw materials to prepare titanium-zirconium-niobium-tin mesoentropy alloys. The sponge titanium and sponge zirconium were irregularly shaped with sizes ranging from 3 to 25 mm. The niobium particles measured 1 to 10 mm, and the tin particles were Φ2 mm × 5 mm. The raw material ratios are shown in Table 1. Materials were weighed using an electronic analytical balance with an accuracy of ±0.005 g. After weighing, samples were ultrasonically cleaned in acetone for 15 minutes, dried, and set aside for later use.
Titanium-Zirconium-Niobium-Tin alloy ingots were prepared using the vacuum arc melting method. Alloy raw materials were sequentially loaded into the crucible based on melting point (lowest to highest). After evacuating the chamber, argon was introduced as the protective gas, maintaining a furnace pressure of -0.05 MPa. To ensure uniform composition of the alloy ingot, the sample was inverted after each melting cycle. The process was repeated 5–6 times until homogeneity was achieved, with each cycle lasting 5 minutes and employing electromagnetic stirring. After melting, the mixture was cooled to room temperature, and samples were taken to obtain the alloy ingot.
1.2 Sample Characterization
The phase composition of the samples was analyzed using a Japanese Rigaku Ultima IV X-ray diffractometer (XRD). Block specimens measuring 10 mm × 10 mm × 3 mm were cut, polished with sandpaper, and subjected to XRD testing. Test conditions: Copper target, tube voltage 50 kV, tube current 50 μA, scanning speed 5°/min, step size 0.02°, with a scanning range of 20° to 100°. After cold embedding, the block specimens were sequentially polished with sandpaper until the surface appeared smooth and flat, with no visible scratches under optical microscopy. Their microstructures were then characterized using a field emission scanning electron microscope (FESEM).
Due to the small size of the alloy ingots prepared in this study and the absence of rolling treatment, only compression testing was performed. An electronic universal testing machine (model SANS-CMT5105) was used with a compression speed of 0.48 mm/min. Specimens were cylindrical with a diameter of 5 mm and length of 8 mm. Surface oxide layers were removed by sanding. Three compression specimens were prepared for each alloy composition to minimize error. Compression stress-strain curves were obtained for the specimens. Nanoscratch testing was employed to characterize the hardness and elastic modulus of the alloys. Magnetic susceptibility was measured using a PPMS comprehensive physical property measurement system. The magnetic susceptibility at ±6 T was measured at room temperature for each alloy composition. The sample dimensions were 2 mm × 2 mm × 2 mm.
2 Results and Discussion
2.1 Phase Analysis
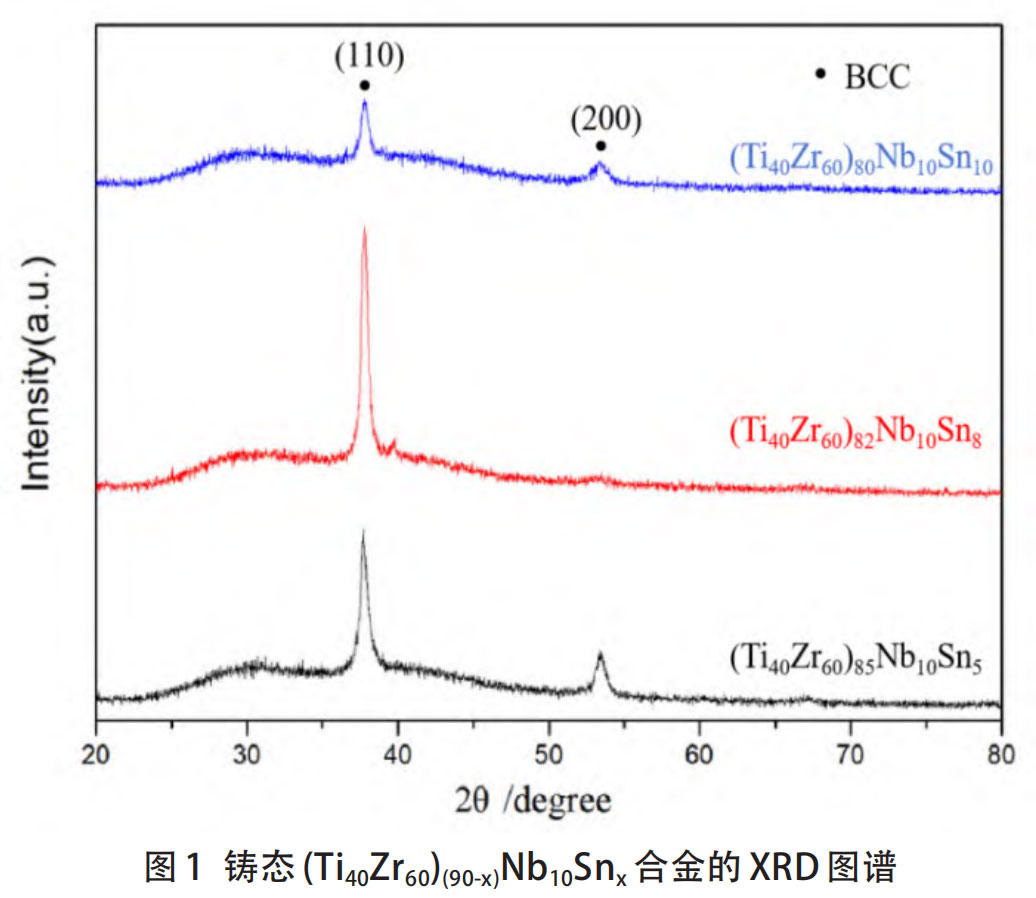
Figure 1 shows the XRD diffraction pattern of the entropy alloy (Ti₄₀Zr₆₀)(90-x)Nb₁₀Sn_x. The alloy's diffraction peaks consist of (110) and (200) crystal planes, corresponding to the diffraction peaks of the BCCTi solid solution.
All three alloys consist of a single BCC solid solution phase, with no intermetallic compounds, martensite, or ω phase formation. The strongest peak appears on the (110) crystal plane. As Sn content increases, the (200) diffraction peak in the crystal structure first weakens and then strengthens, with the highest intensity observed in the 5% Sn alloy. Alloys with large grain size and high crystallinity exhibit intense diffraction peaks in the diffraction pattern, with the (110) crystal plane demonstrating the best crystallinity. Differences in crystal plane indices determine varying grain orientations. Consequently, during alloy solidification, the distribution of atomic positions differs, influencing crystal orientation and ultimately maintaining structural stability through preferred orientation.
As Sn content increases, the alloy's diffraction peaks slightly broaden. Since crystals obtained via vacuum arc melting are typically coarse-grained, relevant studies [10-12] indicate that grain size variations at this stage have negligible impact on peak broadening in XRD testing. Furthermore, since the atomic radii of Zr (0.162 nm) and Sn (0.154 nm) are slightly larger than that of Ti (0.147 nm), it can be inferred that the crystal structure undergoes slight distortion when titanium atoms are substituted by zirconium and tin atoms, thereby affecting other crystalline properties. The XRD results confirm that Zr and Sn, as neutral elements in titanium alloys, have minimal impact on the α/β transformation temperature. They dissolve extensively in both α and β phases, contributing to solid solution strengthening. Conversely, Nb, as a β-stabilizing element, lowers the martensite transformation temperature and effectively suppresses the precipitation of acicular martensite and ω phase. The simultaneous addition of Zr, Sn, and Nb to the titanium alloy facilitates the attainment of a medium-entropy alloy with a low elastic modulus.
2.2 Microstructural Analysis
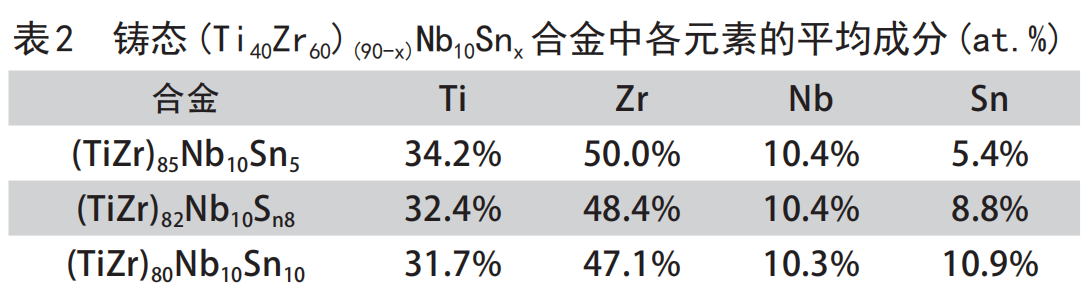
Microstructural and elemental distribution scans were conducted at 1000× magnification using a scanning electron microscope. The elemental distribution map reveals uniform dispersion of Ti, Zr, and Nb throughout the alloy, with no significant elemental segregation observed.
Analyzing the differences in melting points among the alloying elements (melting points: TNb > TZr > TTi > TSn), during alloy solidification, Nb crystallizes first at the dendrites. As the temperature further decreases, Zr and Ti also crystallize at the dendrites and between dendrites. Finally, most of the Sn crystallizes at the grain boundaries. Analyzing the direction of mixing enthalpy from thermodynamic parameters, Sn has the potential to form compounds with Ti, Zr, and Nb. However, Zr-Sn and Ti-Sn exhibit stronger bonding forces. Consequently, Sn may co-distribute with Ti and Zr in the inter-dendritic regions. EDS surface scanning analysis of the medium-entropy alloys yielded the average elemental compositions shown in Table 2. The table indicates slight deviations between the average and nominal compositions for each alloy, attributable to minor volatilization and spattering during melting, as well as differences in the melting points of the constituent elements.
2.3 Mechanical Properties Analysis of Titanium-Zirconium-Niobium-Tin Alloys
2.3.1 Room Temperature Compression Properties
The TiZrNb-based entropy alloy itself is a strongly lattice-distorted solid solution with high strength, exhibiting a tensile yield strength of approximately 830±21 MPa. The addition of a small amount of Sn further enhances the alloy's strength through solid solution strengthening, resulting in values of 822.75 MPa, 1074.49 MPa, and 1216.69 MPa, respectively. Typically, the compressive strength of metallic materials is 1.0 to 2.0 times their tensile strength. These results indicate that this alloy system exhibits both high strength and high plasticity. Further refinement of grain size through methods such as cold rolling followed by recrystallization could be considered to enhance the alloy's performance. Additionally, curve fitting during the elastic deformation stage of compression yielded elastic moduli of 180.21 GPa, 175.29 GPa, and 180.72 GPa for the three alloys. Since no extensometer was used during compression, slight indenter deformation caused minor displacement data discrepancies, affecting the elastic modulus values. To obtain more accurate elastic modulus data, nanoindentation testing was subsequently performed on the alloys.
2.3.2 Nanoindentation Analysis
Nanoindentation results are shown in Figure 2, with a maximum load of 100 mN and a dwell time of 10 s. Under identical loading conditions, the maximum indentation depth (hmax), residual indentation depth after load removal (hf), and maximum load during indentation (Pmax) for each alloy are summarized in Table 3. The small residual indentation depth after unloading and significant elastic recovery indicate substantial elastic deformation and minimal plastic deformation during loading. The (TiZr)80Nb10Sn10 alloy exhibited the smallest residual indentation depth after load removal, demonstrating the strongest resistance to plastic deformation.
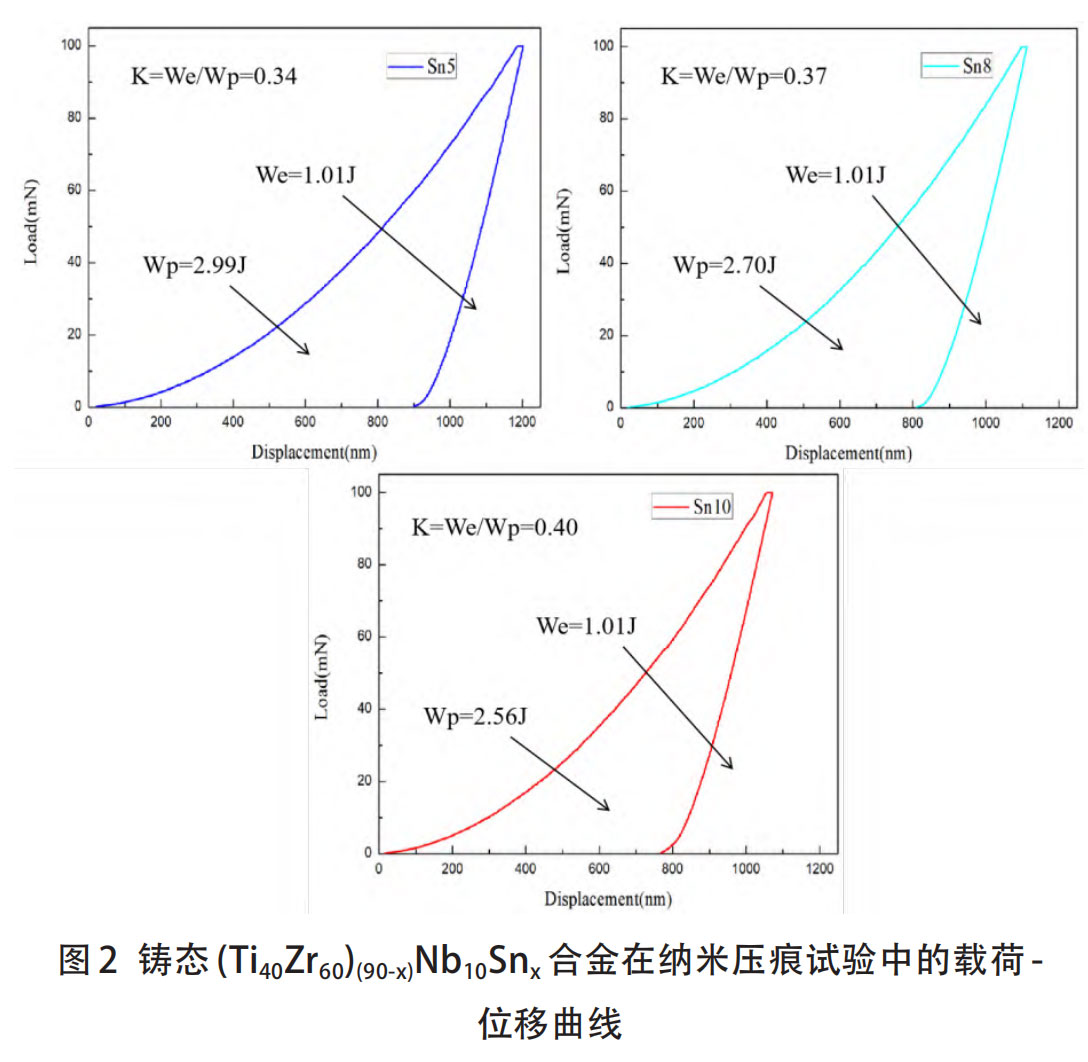
In the load-displacement curve, the area below the unloading curve represents the elastic work (We) performed by the material during indentation testing, while the area between the unloading and loading curves represents the plastic work (Wp). The ratio k between these two values characterizes the material's properties. The area enclosed by the loading and unloading curves characterizes the plastic deformation work of the alloy during loading, indicating the extent of plastic deformation [13]. According to Tuck's theory [14], plastic work (Wp), elastic work (We), and total deformation work (Wt) can be expressed as:
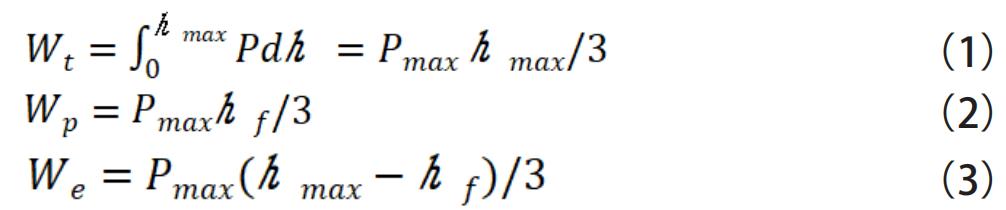
where Pmax is the maximum indentation load.
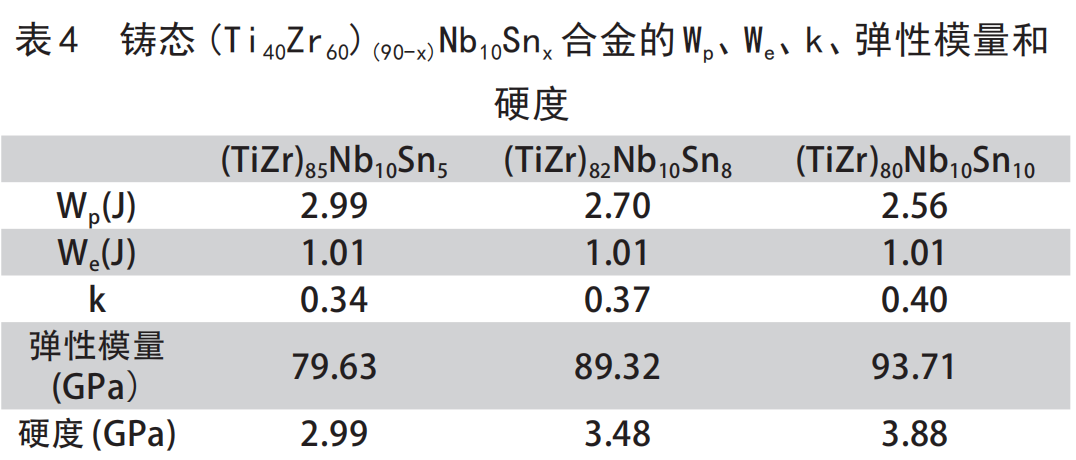
Calculations yielded K values (We/Wp) of 0.34, 0.37, and 0.40 for the alloys. As Sn content increases, the K value progressively rises; a higher K value indicates greater load-bearing capacity of the alloy. The figure also illustrates the magnitude of the alloy's elastic modulus and hardness. Results are summarized in Table 4: the (TiZr)85Nb10Sn5 alloy exhibits a relatively low elastic modulus of 79.63 GPa, while the (TiZr)80Nb10Sn10 alloy demonstrates higher hardness at 3.88 GPa.
2.4 Analysis of Magnetic Susceptibility in Titanium-Zirconium-Niobium-Tin Alloys
2.4.1 Mass Magnetic Susceptibility of Alloys
The M-H curves obtained from comprehensive PPMS testing of the samples are shown in Figure 3, where the horizontal axis represents magnetic field strength (T) and the vertical axis represents magnetization intensity (emu/g). The M-H curves of all alloys exhibit linear trends, indicating typical paramagnetic behavior with weak magnetic field response. Linear fitting of the curves yielded the mass susceptibility values for the alloys.
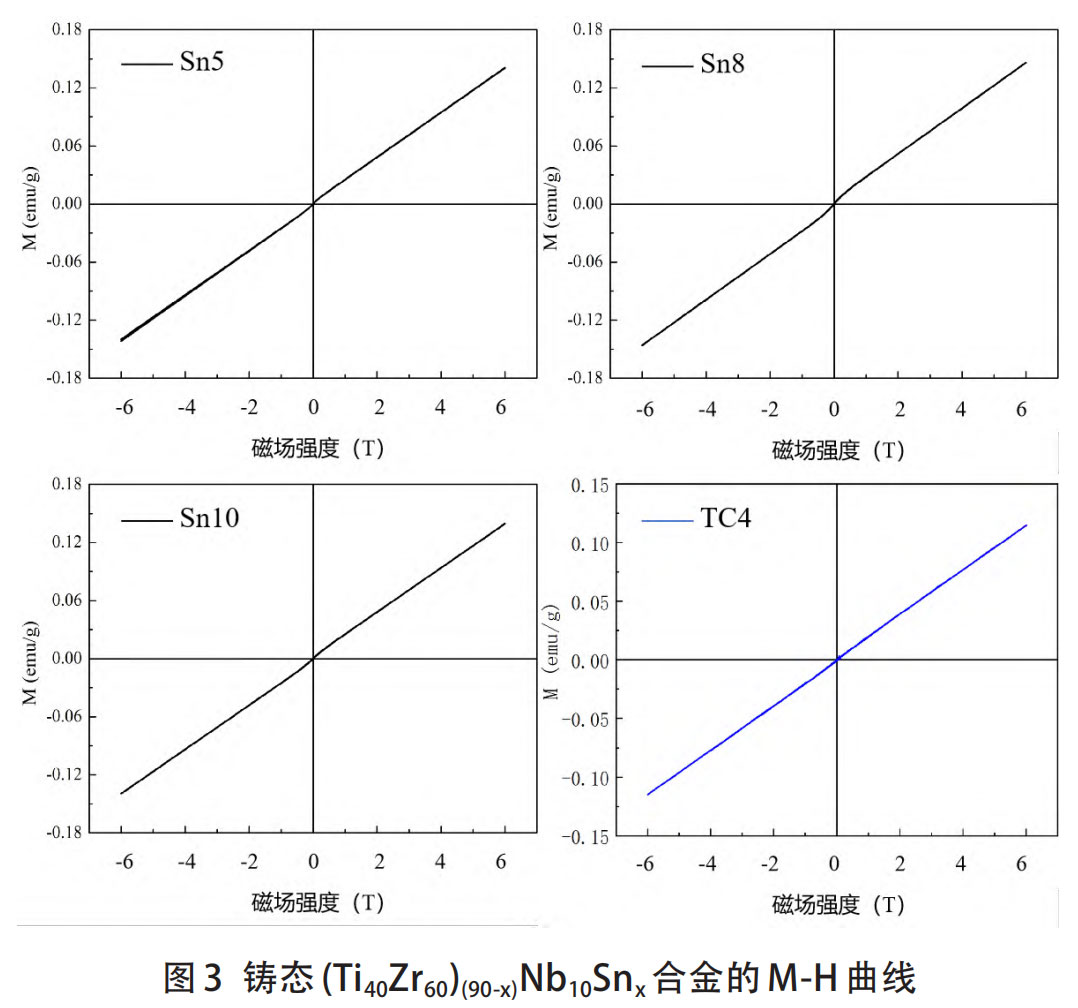
The mass magnetic susceptibility of the alloys is summarized in Table 5. The mass magnetic susceptibility of all three titanium-zirconium-niobium-tin entropic alloys studied in this paper is lower than that of TC4 (3.854×10⁻⁶ cm³/g), indicating that these alloys hold potential for suppressing MRI testing artifacts. With increasing Sn content, the mass susceptibility exhibits a trend of first rising and then decreasing. This indicates that the magnitude of mass susceptibility is not solely influenced by the elemental composition of the alloy. Beyond a certain Sn content, the susceptibility of the alloy may tend toward a relatively stable value. The magnetic susceptibility of the alloy did not decrease continuously with increasing Sn content. This phenomenon may be attributed to grain distortion. As previously mentioned, Sn addition induces lattice distortion. Research by Deng Shanshan et al. [15] indicates that lattice distortion induced by stress exerts a certain influence on the variation of magnetic susceptibility. This result suggests that the change in magnetic susceptibility of the entropy alloy in titanium-zirconium-niobium-tin is not solely related to the material's elemental composition and phase composition but is also associated with factors such as microstress within the grains.

2.4.2 Volume Magnetic Susceptibility of Alloys
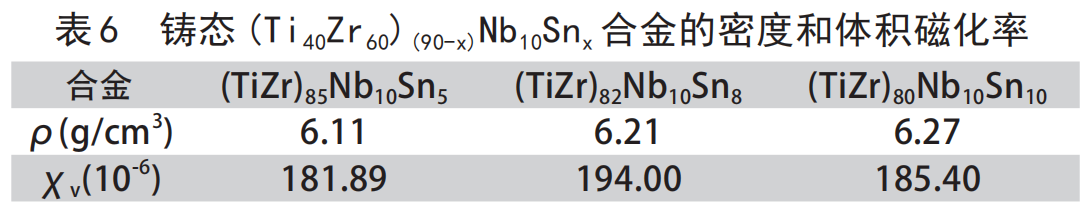
A material with higher magnetic susceptibility per unit volume exhibits a larger MRI artifact area. Therefore, it is essential to determine not only the mass magnetic susceptibility but also the volume magnetic susceptibility of the alloy, as the latter exerts a greater influence on MRI testing. Following the formula, the density of the alloys was first calculated using the Archimedes displacement method, followed by the calculation of their volumetric magnetic susceptibility. The results are shown in Table 6, which lists the densities and volumetric magnetic susceptibilities of the three alloys. Compared to alloys like CoCr (805.5×10⁻⁶) and TC4 (235.08×10⁻⁶), the volumetric magnetic susceptibility of the three prepared alloys shows a significant reduction. Moreover, as the Sn content increases, the volumetric magnetic susceptibility exhibits a trend of first rising and then decreasing, indicating that the same influencing factors also affect the volumetric magnetic susceptibility. The density of Sn is 7.3 g/cm³, higher than that of Ti (4.51 g/cm³). Therefore, the density of the alloyed materials is slightly higher than that of pure titanium. The results indicate that the (TiZr)85Nb10Sn5 alloy exhibits the lowest mass susceptibility and volume susceptibility, with values of 2.369×10⁻⁶ cm³/g and 181.89×10⁻⁶ cm³/g, respectively.
3 Conclusions
The (Ti₄₀Zr₆₀)(90-x)Nb₁₀Sn_x alloy exhibits relatively uniform element distribution without significant segregation, forming a single-phase BCC solid solution structure.
The (Ti₄₀Zr₆₀)(90-x)Nb₁₀Sn_x alloys exhibit good plasticity, with fracture strains exceeding 50%. Among them, the (TiZr)₈₀Nb₁₀Sn₁₀ alloy demonstrates the best plasticity. This alloy exhibits high yield strength and hardness, reaching 1216.69 MPa and 3.88 GPa, respectively. In contrast, the (TiZr)85Nb10Sn5 alloy possesses a lower elastic modulus of 79.63 GPa. Due to its coarse grain structure, grain refinement techniques such as cold rolling followed by recrystallization can be employed to enhance the alloy's properties.
With increasing Sn content, both the mass and volume magnetic susceptibility exhibit a trend of initial increase followed by decrease. The (TiZr)85Nb10Sn5 alloy possesses the lowest mass susceptibility and volume susceptibility, at 2.369×10⁻⁶ cm³/g and 181.89×10⁻⁶ cm³/g, respectively.
Reference: Study on Properties of Low-Permeability Titanium-Zirconium-Niobium-Tin Alloys; Guo Kaiyue, Wang Tao; Nanjing University of Aeronautics and Astronautics, Nanjing 211100, Jiangsu, China
https://kns.cnki.net/kcms2/article/abstract?v=hyKDWyHWvTsuEvtWZyLk6mpPNRbIw4AE3GRFda1F_uDrb7scHCHdl8X48iLe3n7MiZNzfrDiP8rVw6ynxq4ah8P_zaOUWEHa4m8aPtPMxisvVSuIhZiazk_a41sdilKmOcLCrJT25wfTvDW_LpZxemuOFPAaadjm0WaP5FpJkC39MK9JE0eHdQ==&uniplatform=NZKPT&language=CHS
Stardust Technology spherical niobium alloy powders (such as Nb521, niobium-tungsten, niobium-copper, etc.) utilize radiofrequency plasma spheroidization technology at their core. Certain grades undergo raw material smelting into ingots, hydrogenation crushing, and spheroidization, followed by precise dehydrogenation and deoxygenation treatment to achieve low oxygen control (oxygen content <120ppm for some grades). Powder particle sizes span mainstream ranges including 5-25μm, 15-53μm, 45-106μm, and 53-150μm. Products feature high purity (>99.9%), low oxygen content, high sphericity, smooth surfaces free of satellite particles, uniform particle size distribution, and excellent flowability and bulk density, achieving molded densities up to 99.5%. Suitable for 3D printing, hot isostatic pressing, and laser cladding processes, it is widely used in aerospace thermal protection and structural component manufacturing. Applications also extend to medical orthopedic implants, superconducting magnets (e.g., MRI equipment), nuclear industry components, and high-end electronic components (e.g., niobium capacitors), meeting demands for extreme operating conditions and precision manufacturing.For more product information and customization services, please contact our professional sales manager Cathie Zheng, at +86 13318326187.


Signup our newsletter to get update information, promotion and insight.


 IPv6 network supported