Tantalum-tungsten-based alloys inherit the excellent properties of pure tantalum and significantly enhance their mechanical properties through solid solution strengthening [1]. The solid solution of tungsten (W) atoms in the body-centered cubic (BCC) lattice of tantalum causes severe lattice distortion, greatly increasing the resistance to dislocation motion, thereby significantly improving the alloy’s room-temperature and high-temperature yield strength and tensile strength [2]. Among these, the Ta-10W alloy exhibits excellent high-temperature mechanical properties, ductility, corrosion resistance, and impact resistance [3]. Unlike many brittle refractory metal alloys, high-tungsten tantalum-based alloys retain a certain degree of plasticity at room temperature, allowing for plastic processing such as forging, rolling, and drawing, while maintaining an extremely high strength retention rate and excellent creep resistance even at ultra-high temperatures [4]. The addition of W raises the ductile-to-brittle transition temperature of the alloy, meaning that high-tungsten tantalum alloys are more prone to embrittlement at room temperature. Oxygen (O) has a certain solubility in tantalum; it strongly pin-points dislocations, leading to a sharp increase in yield strength while simultaneously causing the material to lose plasticity, resulting in room-temperature brittleness [5]. Even at low concentrations, it can cause tantalum alloys to transition from ductile fracture to brittle fracture; similarly to O, nitrogen (N), as an interstitial atom dissolved in the tantalum lattice, also significantly increases strength and hardness, but simultaneously leads to severe room-temperature embrittlement [6].
Precisely because tantalum-tungsten-based alloys possess the unique combination of “high strength and good plasticity” as their core mechanical properties, and because these excellent properties are maintained even at extremely high temperatures [7], they are widely used in fields such as aerospace and hypersonic vehicles [8], advanced nuclear reactor structures [9], armor-piercing projectiles [10], and medical materials [11]. Impurity elements adversely affect the properties of tantalum-tungsten alloys, and their content must be precisely measured and strictly controlled [12]. The primary hazard posed by O and N is that they cause a transition from ductile to brittle behavior; for this reason, O and N are harmful impurities that must be rigorously avoided in tantalum-tungsten-based alloys [13]. Any potential limited benefits are contingent upon extremely strict control of composition and microstructure, and the benefits generally outweigh the drawbacks. Therefore, consistently striving for the lowest possible O and N content during alloy preparation and processing is key to ensuring superior mechanical properties.
This method, based on the existing equipment at Ningxia Dongfang Tantalum Co., Ltd., draws on the detection methods for gaseous elements in pure tantalum products. It involves the complete release of gaseous elements from the sample, followed by quantitative analysis using infrared absorption or thermal conductivity detection, thereby enabling rapid detection of O and N. This method overcomes the challenges posed by the ultra-high melting point and complex matrix effects of tantalum-tungsten-based alloys, including issues such as ultra-high-temperature pulse heating, efficient flux systems, and matrix matching calibration, thereby establishing a detection method for O and N in tantalum-tungsten-based alloys. This method offers high accuracy and precision, along with high sensitivity. It is simple and rapid to operate, effectively addressing the challenge of accurately determining O and N content in tantalum-tungsten-based alloys and meeting production requirements.
1. Experiment
1.1 Equipment and Reagents
Equipment: ON836 Oxygen-Nitrogen Simultaneous Analyzer.
Anhydrous magnesium perchlorate: LECO, USA, granular.
Inert-base caustic soda: LECO (USA), granular.
Rare earth copper oxide: LECO (USA), granular.
Copper turnings: LECO (USA), filamentary.
Helium: Purity ≥99.99% (by volume).
High-purity nickel foil: w(O) < 0.0010%; w(N) < 0.0005%.
High-purity graphite crucibles: Set of crucibles.
Standard samples: Two sets, with the following compositions:
BY-1: w(O) = 0.0271% ± 0.0013%;
w(N) = 0.0037% ± 0.0006%.
BY-2: w(O) = 0.3610% ± 0.0060%;
w(N) = 0.0480% ± 0.0030%.
1.2 Preparation of Test Samples
A total of six sets of samples were used in the test, provided by Ningxia Dongfang Tantalum Industry Co., Ltd. Metal powders were prepared according to the composition ratio of grade TaW10 [14] specified in GB/T 14841—2008 “Tantalum and Tantalum Alloy Bars.” These powders were then loaded into the sealed chamber of a vibratory ball mill along with grinding media. Under the protection of high-purity argon gas, the grinding balls subjected the powder particles to repeated collisions, compression, cold welding, fragmentation, and re-welding, ultimately achieving alloying at the atomic level to form a solid solution with uniform composition. After ball milling is complete, the powder is separated from the grinding balls under a high-purity argon atmosphere [15].
Samples are taken, ensuring that each sample weighs no less than 10 g. They are sealed, packaged, and numbered for testing. The numbers are marked in sequence as:
TW-1, TW-2, TW-3, TW-4, TW-5, TW-6.
The test samples include the two sets of standard samples prepared in Section 1.1.
1.3 Principle of the Determination Method and Instrument Settings
1.3.1 Principle of the Determination Method
The sample is heated and combusted in a stream of oxygen within a high-frequency induction furnace to produce CO₂. The CO₂ is carried by the oxygen stream into the measurement chamber of an infrared analyzer, where it absorbs infrared energy at a specific wavelength. The absorbed energy is directly proportional to the concentration of CO₂; the mass fraction of carbon can be determined based on changes in the energy received by the detector [16]. Nitrogen is released in the form of N₂ and detected by a thermal conductivity detector. The resulting detection signals are processed by a microcomputer and converted into concentration values, with the O and N contents displayed on the screen.
1.3.2 Instrument Settings
The instrument settings are shown in Table 1.
1.4 Test Method
Conduct a systematic inspection of the instrument to ensure it is in normal operating condition, and set the optimal analysis conditions as shown in Table 1. First, perform a blank test, then select the corresponding standard sample to calibrate the instrument. When analyzing the sample, use the same analysis conditions and method as in the blank test. Weigh the sample from the pre-treated nickel foil, place it in the sampler, and then read the analysis results from the instrument.
2 Results and Discussion
2.1 Selection of Degassing Power
During instrument degassing, a relatively high temperature must be maintained to reduce the blank; however, the temperature must not be too high to prevent system contamination caused by graphite crucible volatilization and to avoid shortening the service life of the furnace head. To obtain stable, low blank values, this experiment compared blank values under different power conditions and ultimately determined the most suitable degassing power. The results are shown in Table 2. The results indicate that when the degassing power is below 5.0 kW, the blank is unstable; when the power is between 5.5 and 6.0 kW, the blank is low and stable. After comprehensive consideration, a degassing power of 5.5 kW was selected.
2.2 Selection of Analysis Power
The magnitude of the analysis power corresponds to the melting temperature of the sample and is one of the key factors affecting the analytical results [17]. The analysis power of the oxygen-nitrogen co-analyzer significantly affects the release of O and N from tantalum-tungsten-based alloy samples. Therefore, using TW-4 samples, the release of O and N from tantalum-tungsten-based alloy samples was tested under different analysis powers. The results are shown in Table 3.

The results indicate that when the analysis power is 4.5 kW or lower, the O and N results are low, and the release is incomplete. Within the range of 5.0–5.5 kW, the O and N measurement results tend to stabilize; therefore, an analysis power between 5.0 and 5.5 kW fully meets the requirements. Considering that higher power accelerates furnace head wear and reduces equipment service life, and in accordance with recommendations for gas analysis equipment—which generally suggest that the analysis power should be 0.5 kW lower than the degassing power—the analysis power for this experiment was ultimately set at 5.0 kW after referencing other analytical methods.
2.3 Experiment on Selection of Nickel Flux Dosage
Referring to GB/T 15076.13-2017 "Methods for the Chemical Analysis of Tantalum and Niobium—Part 13: Determination of Nitrogen Content by Inert Gas Fusion Thermal Conductivity Method” [18] and GB/T 15076.14-2008 “Methods for the Chemical Analysis of Tantalum and Niobium—Determination of Oxygen Content” [19], and considering economic principles, nickel was selected as the flux. Under identical analytical conditions, the ratio of sample mass to nickel flux has a significant impact on the analytical results. Therefore, after determining the sample quantity, experiments were conducted by varying the amount of nickel flux to determine the mass ratio of flux to sample. The results are shown in Table 4.
The results indicate that when the mass ratio of nickel flux to sample is 6:1 or higher, O and N in the sample can be completely released. Consequently, a mass ratio of 6:1 between the nickel flux and the sample was selected for this experiment.
2.4 Sample Weight Experiment
In gas analysis, if the sample weight is too low, factors such as system blank have a significant impact on the analytical results. Conversely, if the sample weight is too high, the melt is more likely to overflow from the crucible, obstructing gas escape and leading to underestimated results [20]. In this experiment, different tantalum-tungsten-based samples were weighed to conduct sample weight experiments; the results are shown in Table 5.
The data in the table indicate that when the sample weight is less than 0.070 g, the results exhibit relatively large fluctuations; when the sample weight is between 0.070 and 0.120 g, the results are stable. Therefore, the sample weight should be selected within the range of 0.070 to 0.120 g. In this experiment, sample representativeness was prioritized, and a sample weight of 0.080–0.100 g was prudently selected. This approach effectively mitigates the risk of fluctuations associated with low sample weights while preventing the release of gases from the melt from being hindered by excessive sample volume, which could lead to underestimated results.
2.5 Establishment of the Calibration Curve
By measuring the response signals of the standard samples, a linear relationship is established between the O and N concentrations in the test samples and the instrument; this relationship is then used to calculate the concentration of these substances in the unknown samples [21]. Using the optimal experimental conditions determined in the aforementioned experiments, a standard curve was constructed using two standard samples, as shown in Figure 1.
The regression equation for O is:
y = 0.63601255x + 0.00000476;
The regression equation for N is:
y = 0.82180276x + 0.000000213.
Additionally, the R² value for the O standard curve is 0.999328, and for the N standard curve, it is 0.999347, indicating good linearity. These standard curves are suitable for determining the O and N content in tantalum-tungsten alloys.
2.6 Method Detection Limit and Quantification Limit
Blank tests were conducted on the nickel flux used in the analysis, with 11 consecutive measurements. The detection limit was defined as 3 times the standard deviation, and the quantification limit as 10 times the standard deviation [22]. The test results are shown in Table 6.


Analysis of the blank values indicates that the analytical process involves numerous materials, and there are many factors affecting blank stability; nickel foil also influences the O and N content values [23]. Therefore, in accordance with GB/T 27417—2017 “Guidelines for the Qualification and Validation of Chemical Analytical Methods” [22], which stipulates that the detection limit for an element is defined as three times the standard deviation and the quantification limit as ten times the standard deviation, combined with the provisions for data rounding, and considering that the detection of gaseous elements is influenced by various reagents and auxiliary materials, the lower limit of determination for O is set at 0.0010% and for N at 0.0005%, taking all these factors into account. Compared to the detection limits for O and N, the limits of quantification are significantly higher than the detection limits; therefore, the determination of the limits of quantification is reasonable.
2.7 Method Precision Test
Under the selected analytical conditions, the tantalum-tungsten-based alloy samples submitted for analysis were tested in duplicate; the results are shown in Table 7.
As shown by the data in the table, the sample analysis results fluctuate within the acceptable range, with an RSD < 6% for O and an RSD < 10% for N; the method meets the requirements for analytical testing [24].
2.8 Spiked Recovery Test
Spiked recovery is a core indicator for evaluating the accuracy of analytical methods in quality control. It reflects the method’s accuracy by adding a known quantity of a standard substance to a blank or sample matrix and calculating the ratio of the measured result to the theoretical value (typically calculated using results adjusted for sample background) [25]. The formula for spiked recovery is shown in Equation (1):

Samples TW-1 and standard BY-2 were selected for the spiked recovery test: a specific amount of sample and standard was weighed and simultaneously placed in a nickel flux according to the selected analytical method; the results are shown in Tables 8 and 9.
The data in the tables show that the recovery rates for O range from 94.43% to 98.01%, and those for N range from 97.85% to 100.22%, indicating that the test results are accurate and reliable.
For further validation, samples TW-5 and standard BY-1 were selected for standard addition recovery tests: a specific amount of sample and standard was weighed and placed simultaneously in a nickel flux according to the selected analytical method; the results are shown in Tables 10 and 11.
The data in the tables show that the recovery rates for O ranged from 97.09% to 99.17%, and those for N ranged from 97.29% to 102.11%, indicating that the test results are accurate and reliable.
Based on the two spiking recovery experiments, the validation results from both tests show that the spiked recovery rates for O ranged from 94.43% to 99.17%; and the spiked recovery rate for N ranges from 97.29% to 102.11%. Both fall within the required range, meet the expected requirements, and confirm that this experimental method and its parameters are stable and reliable.
2.9 Experimental Method and Accuracy Validation
A standard curve was established using existing equipment and standard samples. Combined with the parameters obtained from the previous experiments, this validated that the method can consistently and stably produce accurate and reliable analytical results within the specified experimental parameters.


The results are shown in Table 12.
Based on the test results, the samples melted normally throughout the entire testing process. Examination of the detection curves revealed that the peaks exhibited a normal distribution with no tailing (as shown in Figure 2), indicating that the established standard curve is appropriate and that the parameters derived from the experiments fully meet the testing requirements for routine production.
.png "表10-11.png")


3 Conclusions
In this study, a method for determining O and N in tantalum-tungsten-based alloys using the inert-gas fusion infrared absorption/thermal conductivity method was established through experiments involving analysis power, degassing power, sample weight, and other parameters. Using the ON836 oxygen-nitrogen analyzer, with nickel as the flux, a sample weight of 0.070–0.120 g, an analysis power of 5.0 kW, and a degassing power of 5.5 kW, accurate detection of O and N in tantalum-tungsten-based alloys can be achieved. The detection limits for O and N are 0.0010% and 0.0005%, respectively. The spiked recovery rates for O range from 94.43% to 99.17%, and for N from 97.29% to 102.11%. The relative standard deviation (RSD) for O is<6% and for N is <10%, meeting practical testing requirements. This analytical method is designed for the determination of O and N content in tantalum-tungsten-based alloys. It features high sensitivity, good accuracy and precision, as well as fast analysis speed and a wide detection range, effectively helping workshops improve production efficiency.
Reference: Vol. 43, No. 1 – Cemented Carbides – February 2026; Study on Analytical Methods for Determining Oxygen and Nitrogen Content in Tantalum-Tungsten-Based Alloys Using Inert Gas Fusion-Infrared Absorption/Thermal Conductivity; Liu Rui; Wang Gang; Li Xiaoyang
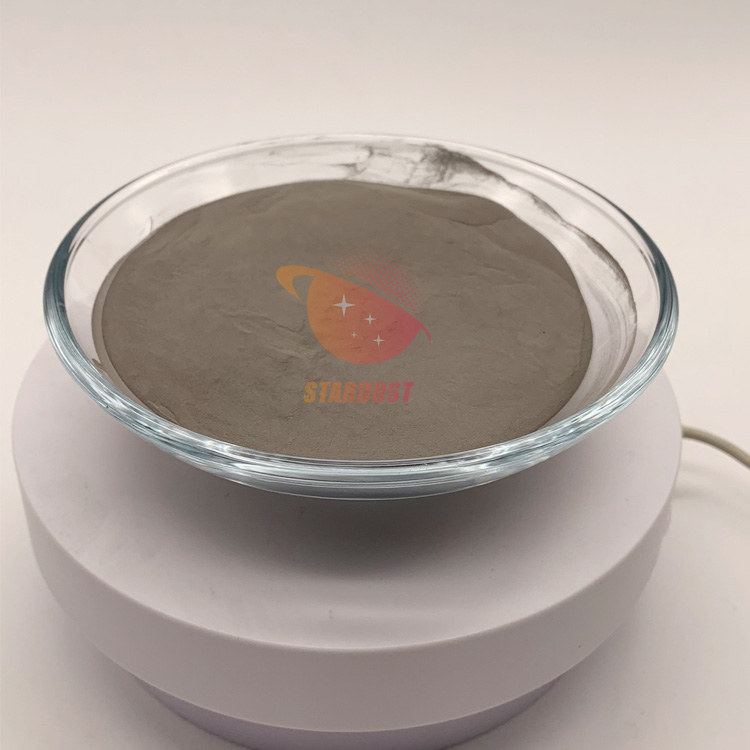
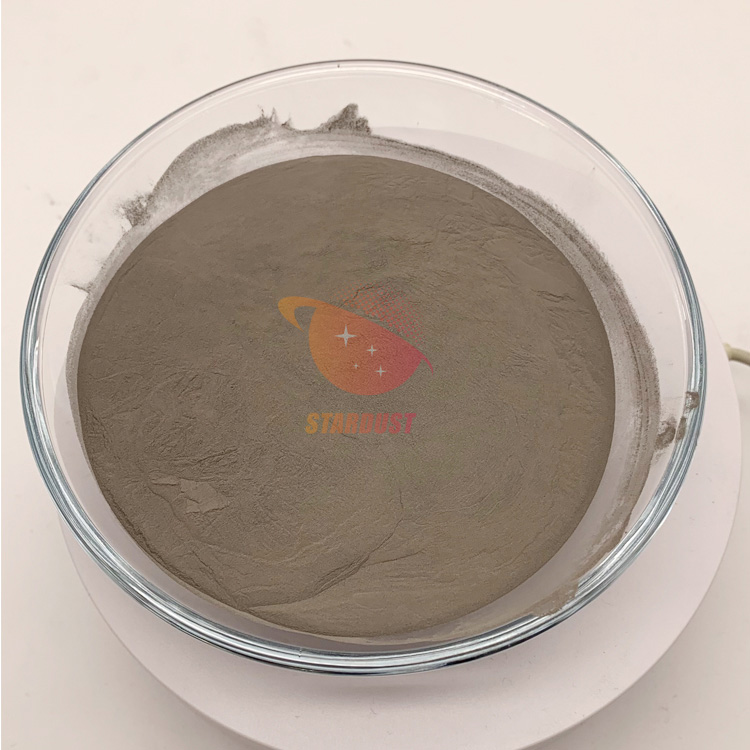
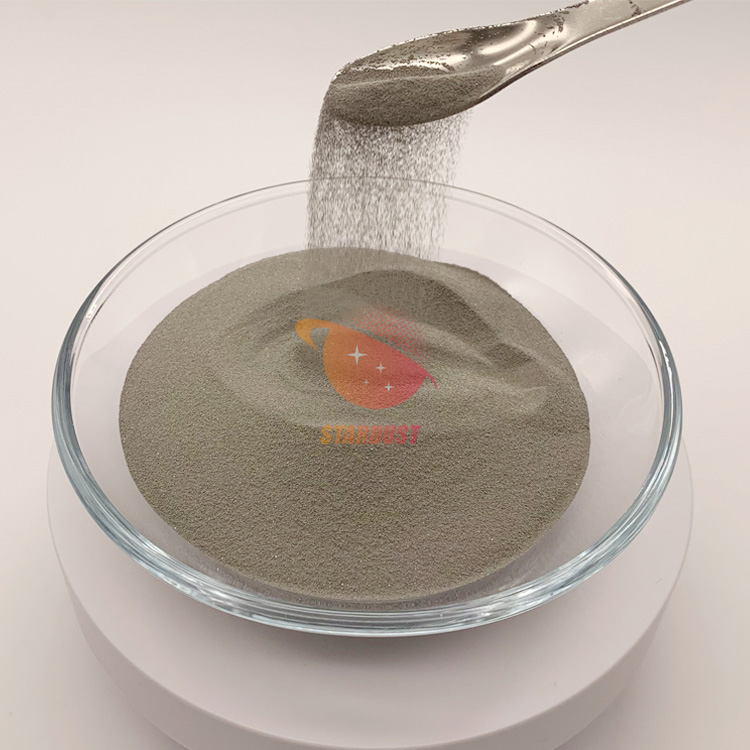
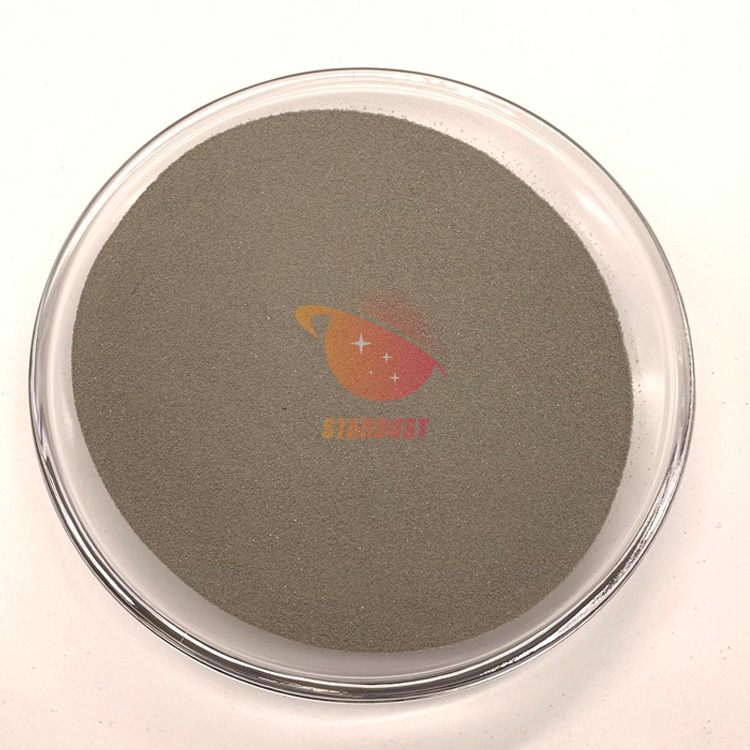
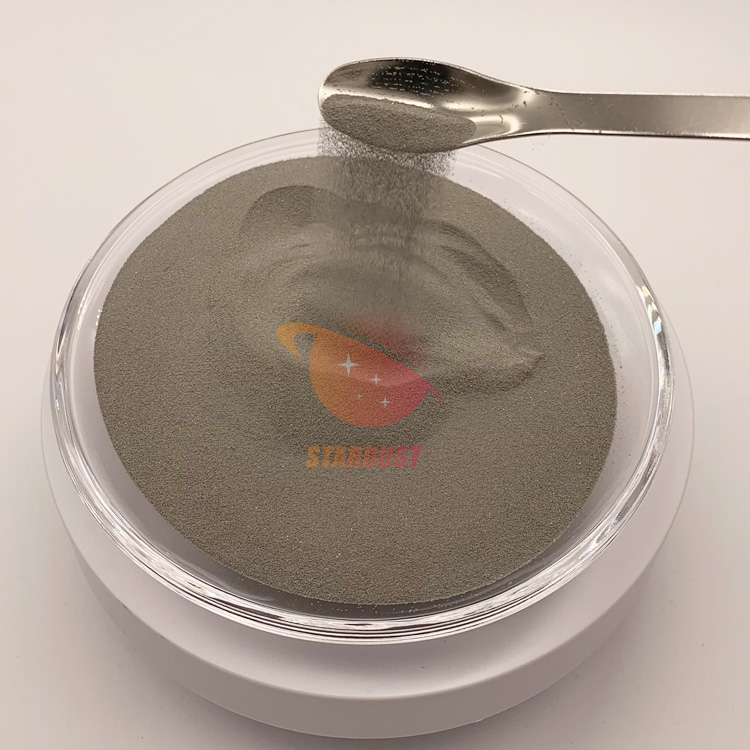
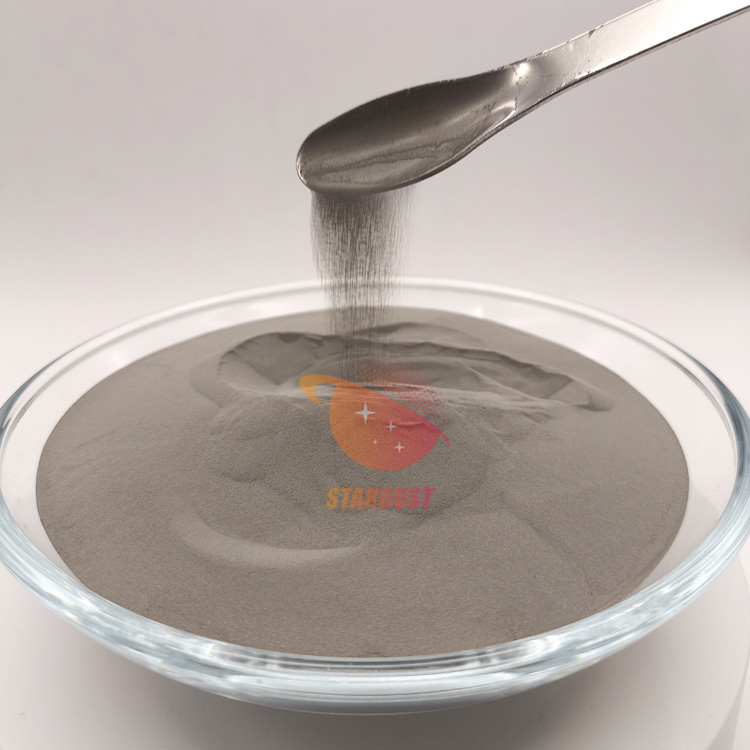
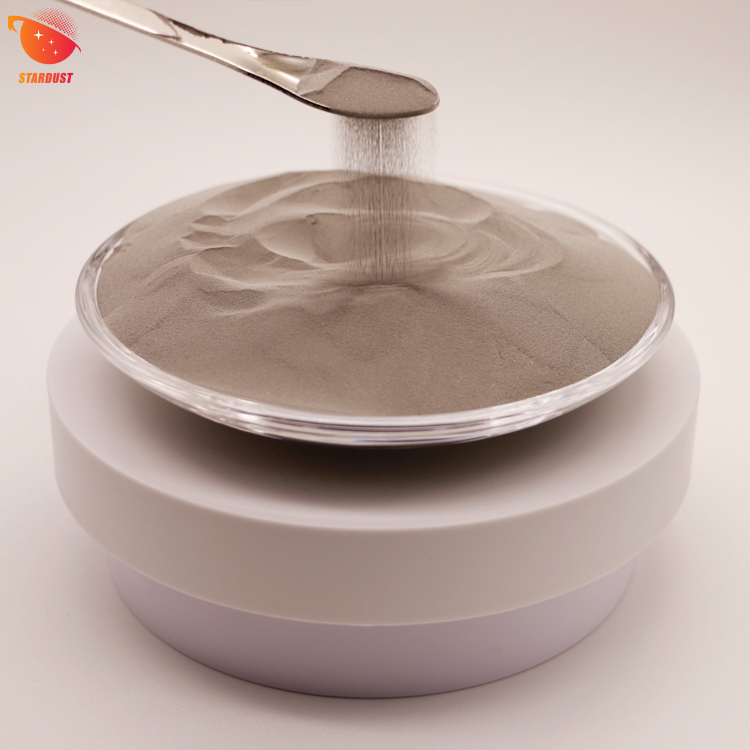
Stardust Technology’s spherical tantalum-tungsten alloy powder is a high-end refractory metal alloy powder developed and produced by the company using its core technology of radio-frequency plasma spheronization. It is part of the company’s series of high-end rare refractory metals and their alloy spherical powders, and has obtained quality management system certifications including ISO 9001:2015, ISO 13485:2016, GJB9001C-2017, ensuring stable and controllable product quality. This alloy powder primarily covers common grades such as Ta10W, with a primary particle size range of 15–53 μm. Custom particle sizes can be tailored to meet specific customer requirements. The powder features high purity, low oxygen content, high sphericity, a smooth surface free of satellite particles, and a uniform particle size distribution. It also exhibits excellent flow properties, as well as high bulk density and tapped density, making it suitable for various 3D printing processes such as SLM and EBM, as well as mainstream processes like powder metallurgy and thermal spraying. Its core strengths lie in the company’s years of accumulated experience in powder R&D and the support of national-level research platforms. This enables uniform and controllable composition, strict compliance with impurity limits, and powder performance on par with comparable high-end international products. Furthermore, the company possesses large-scale production capabilities and can provide customers with integrated solutions for powder preparation, modification, and application. This product has a wide range of applications, including the manufacture of critical components for high-temperature environments in the aerospace sector, specialized components for the defense and military industries, and radiation-resistant parts for the nuclear energy industry. Additionally, thanks to its excellent performance, it can be applied in fields such as telecommunications electronics and high-end equipment manufacturing, meeting the high-performance demands for premium refractory alloy powders across various industries. For more product information, please contact our professional sales manager, Cathie Zheng, at +86 13318326187.


 IPv6 network supported