Search...
What Are You Looking For?
0 Introduction
Surface ships are susceptible to damage from explosive shock wave loads [1-3]. With the continuous development of industrial technology, the demand for lightweight ship protection structures has become increasingly urgent. There are two common methods for achieving structural lightweighting: one is through material weight reduction, using lightweight materials such as light metals and composites to improve the overall structural mass [4]; the other is through structural weight reduction, such as honeycomb sandwich structures [5-8], foam structures, origami structures, etc., to achieve structural lightweighting [9-10]. Some of these new protective structures, due to their unique shapes, are difficult to prepare using traditional processing methods. 3D printing technology, due to its unique processing method, has become the preferred method for processing complex protective structures.
Selective laser melting (SLM) is a relatively mature 3D printing technology [11]. However, temperature gradients often occur during model processing, leading to residual stresses in the processed model [12] and potentially resulting in defects such as pores, gas holes, and incomplete melting [13-14]. These defects reduce the density of the fabricated components, cause stress concentration, and thus affect their performance [15]. To minimize defects in metal additive manufacturing, appropriate process parameters can be selected to limit defect formation [16-17].
For example, Fu Liding et al. [18] optimized processing parameters through orthogonal experiments on SLM process parameters, thereby improving the density of 316L steel material specimens. Li et al. [19] investigated the effect of scan speed on the forming quality of 316L steel material, finding that a lower scan speed results in fewer pores and smaller pore sizes. Cherry et al. [20] studied the impact of laser power on the forming quality of 316L steel material, with results showing that as laser energy density increases, porosity gradually decreases. These studies indicate that SLM forming quality is closely related to process parameters, and improving process parameters can enhance the quality of processed parts.
In studying the influence of internal porosity on mechanical response, some scholars [21-22] combined ductile damage models with finite element simulations, considering the impact of initial porosity on damage evolution, and found that finite element simulation results exhibit good consistency with experimental results. Micro-damage mechanics posits that damage in ductile metallic materials during forming and processing can be described through the nucleation, growth, and coalescence processes of internal micro-pores [23-24]. Gurson [25] proposed a ductile metal plastic yield function incorporating the void volume fraction (VVF), which was modified and refined by Tvergaard and Needleman to form the Gurson-Tvergaard-Needleman (GTN) micro-damage model [26-27]. This model links the macroscopic mechanical behavior of the material to the volume fraction of porosity, thereby enabling the connection between microstructural changes and macroscopic mechanical property changes. Numerous studies have demonstrated that the GTN model provides important references for research on the ductile damage behavior of metals [28-29]. However, due to the influence of internal defects on damage parameters, the internal VVF is difficult to measure accurately, making the damage model of the same material inapplicable to all 3D-printed models.
In this study, 316L steel tensile specimens and lattice structures will be prepared using the SLM manufacturing method, and tensile and compression tests will be conducted separately. Through central composite design (CCD)–response surface method (RSM) experimental design, the GTN damage parameters will be calibrated, and the damage parameters applicable to the 316L steel material model will be optimized. Finally, based on the calibrated damage parameters, numerical simulation calculations of the lattice structure will be conducted, and the effects of pore defects on the compressive performance and mechanical properties of the lattice structure will be analyzed in conjunction with experimental results.
1 Model Design and Processing
1.1 Structural Design
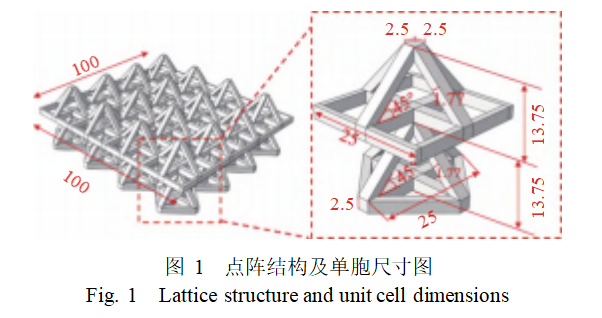
The lattice structure designed in this study consists of a single-cell model arranged in a 4×4×1 configuration. The single cell comprises the following components: an upper pyramid-shaped structure, an upper outer frame and internal cross-shaped base, a lower pyramid-shaped structure, and a lower outer frame and cross-shaped base. The model is primarily defined by five parameters: outer frame height, central rod width, pyramid sloped rod thickness, pyramid height, and sloped rod inclination angle. Additionally, there is the parameter of unit cell length. The specific dimensions of the model are shown in Figure 1. The numerical units in the figure are in millimeters.
1.2 Structural Processing
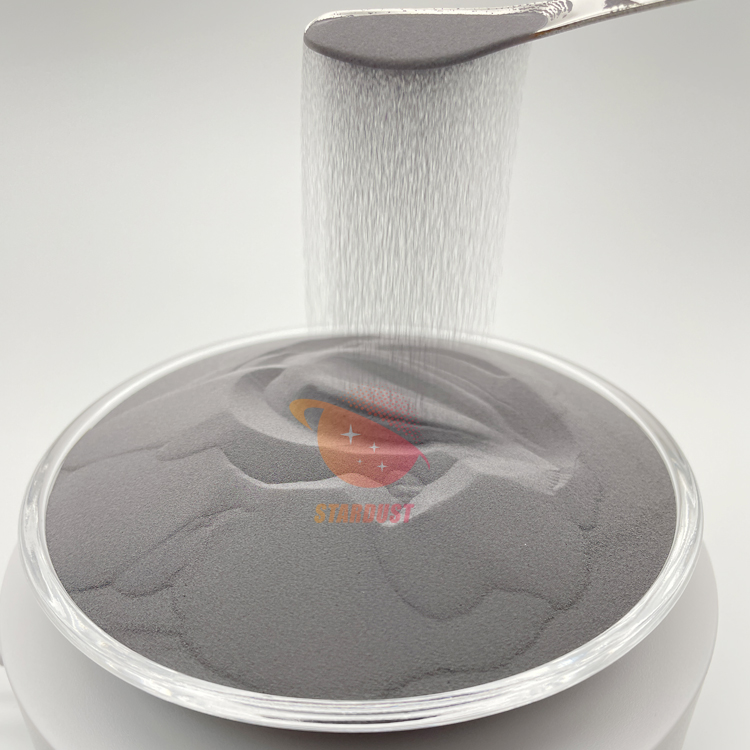
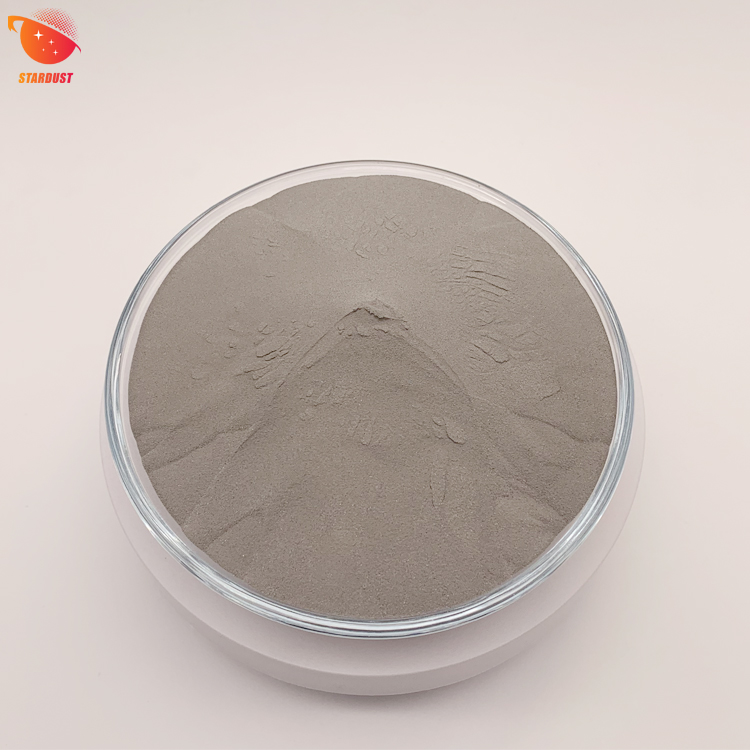
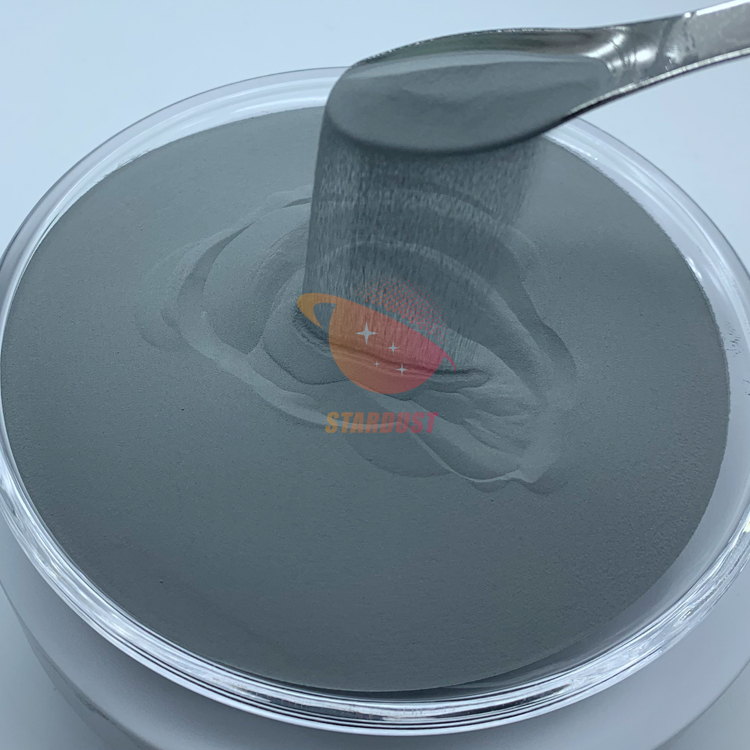
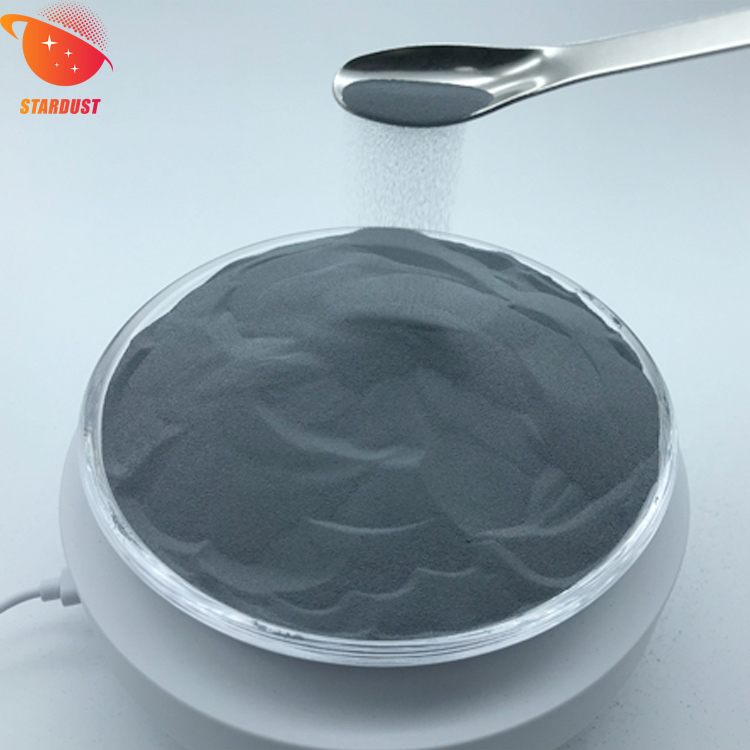
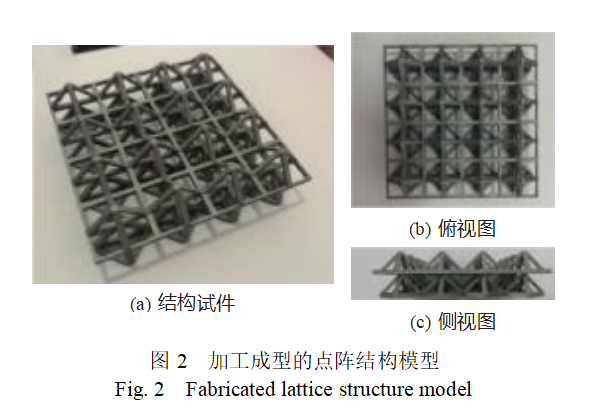
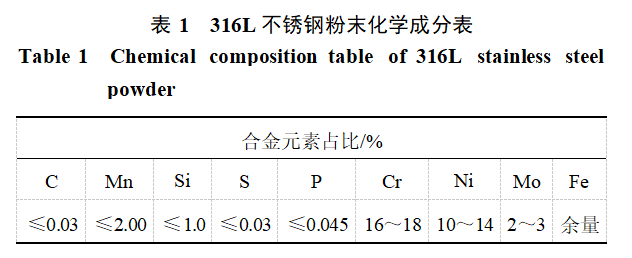
The test model was fabricated using 316L stainless steel powder as raw material via the SLM process. The chemical composition of the 316L powder is shown in Table 1. The main processing parameters for SLM include laser power, scanning speed, scanning spacing, and powder layer thickness. The specific parameter settings are as follows: laser power 260 W, scanning speed 1200 mm/s, scanning spacing 0.1 mm, and powder layer thickness 0.04 mm. The processed model is shown in Figure 2.
 2 Model Testing
2.1 Uniaxial Tensile Testing of Materials
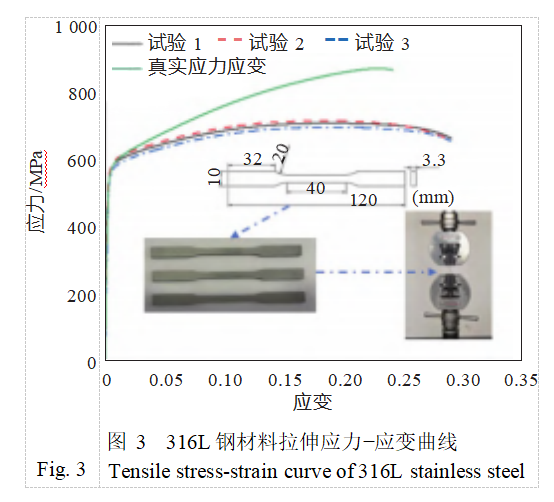
To accurately determine the tensile mechanical properties of the base material, three tensile specimens were prepared using the same 3D printing process. In the mechanics laboratory of the School of Naval Architecture, Ocean Engineering, and Energy Power at Wuhan University of Technology, the mechanical properties of the tensile specimens were tested using a WDW-100 type microcomputer-controlled electronic universal testing machine under room temperature conditions. The loading rate was set to 2 mm/min during the test. Figure 3 shows the measured stress-strain curve. From this, the Young's modulus and yield strength of the 316L steel material were determined to be 203.85 GPa and 582.46 MPa, respectively.
2.2 Lattice Structure Compression Testing
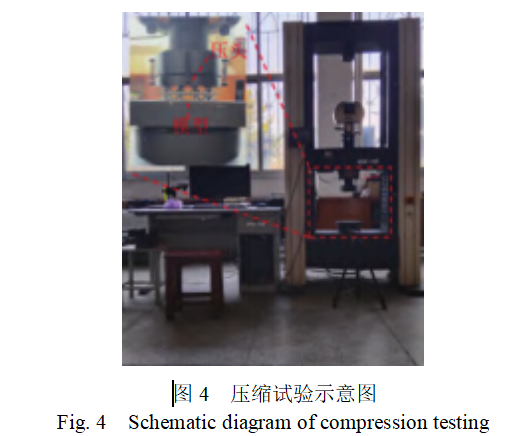
The mechanical properties of the lattice structure under compression were studied using a WDW-300 microcomputer-controlled electronic universal testing machine, with results shown in Figure 4. To investigate the deformation and mechanical properties of the lattice structure under compression, a compression test was conducted on 316L stainless steel specimens at a constant loading rate of 2 mm/min, and the compression displacement, reaction force, and deformation behavior were recorded. The stress-strain curve obtained from the compression test is shown in Figure 5. It can be seen that the entire compression process can be divided into four stages: I to IV.
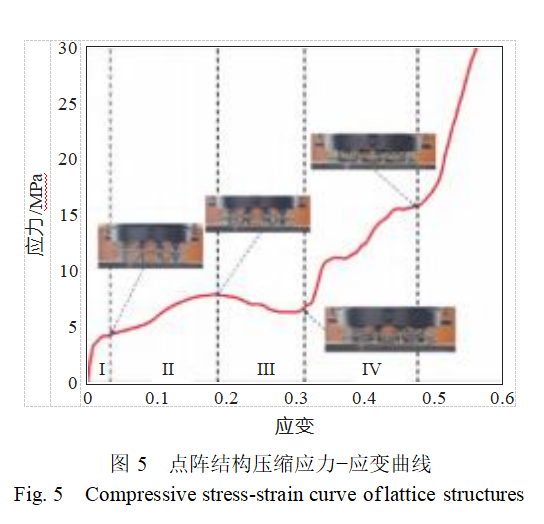
1) Initial elastic stage I: Strain range is 0–0.025. In this stage, the stress-strain curve exhibits an approximate linear relationship, with stress continuously increasing. The upper panel contacts the highest point of the structure, and the entire structure is subjected to compressive load; however, the overall structure does not undergo significant deformation, and deformation of the upper cell elements begins.
2) Plastic deformation stage II: As the panel continues to descend, the lattice structure begins to undergo plastic deformation and failure. When the strain reaches 0.173, the first peak occurs, with a peak stress of 7.8 MPa. At this point, the cross-support structure of the upper layer cells undergoes bending deformation, and when the strain value reaches 0.192, the upper layer diagonal rods begin to undergo bending deformation.
3) Yield deformation stage III: Strain range is 0.192 to 0.32. During this stage, stress decreases. The diagonal rods in the upper cell elements have undergone plastic yielding and continue to undergo plastic deformation. The top of the upper cell elements is compressed to contact the top of the lower cell elements but has not yet fully contacted the bottom, so the overall structure remains compressed in the vertical direction until the diagonal rods of the lower cell elements begin to deform. Additionally, the upper cell elements on both sides exhibit greater bending deformation and contact the bottom.
4) Densification Stage IV: Strain range is 0.32–0.48. During this stage, stress gradually increases. The bottom end of the upper cell element comes into contact with the bottom end of the model, and the inclined rods of the lower cell element are fully deformed. When stress reaches 15.62 MPa, stress increases sharply, and the specimen enters the densification zone, with the entire model being flattened.
3 316L Steel Material Model GTN Damage Parameters Solution
3.1 GTN Damage Model
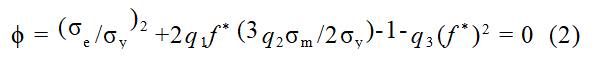
This paper adopts the GTN model as the damage model. This model accounts for internal defects generated during structural manufacturing and describes the ductile damage and fracture process of metallic materials based on the continuous elastic-plastic model. The GTN damage model quantifies the contribution of pores to specimen failure by considering the nucleation, growth, and coalescence mechanisms of pores [30]. The equations of the damage model are expressed as
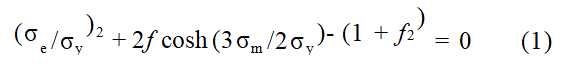
where: σe is the macroscopic equivalent stress (von Mises stress); σy is the yield stress of the matrix material (yield strength without pores); σm is the macroscopic hydrostatic stress; f is the current pore volume fraction.
Tvergaard and Needleman supplemented and improved upon the Gurson model. They found that the original Gurson model could not adequately describe the rapid decline in load-bearing capacity during the late stages of deformation in metallic materials. Therefore, they introduced three correction factors q1, q2, and q3, as well as the concept of equivalent pore volume fraction. The GTN yield function applicable to isotropic strengthened materials has the following form:
where: f* is a piecewise continuous function used to describe the coalescence and aggregation of microvoids during material necking. When the void volume fraction f reaches the critical value determined by the coalescence criterion, coalescence occurs. In the damage model, f is replaced by f*:
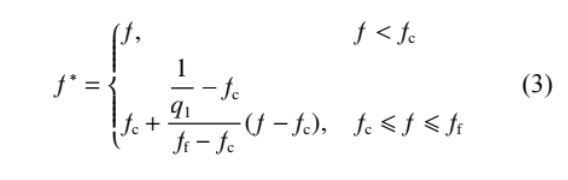
Where: fc is the critical pore volume fraction at the onset of pore deformation; ff is the pore volume fraction at material fracture.
The damage variable is represented by a scalar, the pore volume fraction, which increases from two sources:

where: fgrowth denotes the rate of change in the pore volume fraction ratio caused by pore growth; fnucleation denotes the rate of change in the pore volume fraction ratio caused by pore nucleation. Based on the principle of mass balance, assuming the matrix is incompressible, pore growth depends on macroscopic plastic deformation, and fgrowth is related to the hydrostatic component of plastic strain, which can be expressed as
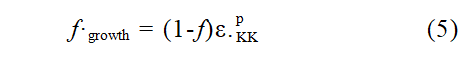
where: ε. denotes the plastic strain rate, where the superscript p represents physical properties related to plasticity, and the subscript KK generally denotes conventions related to tensor notation. In tensor operations in continuum mechanics, such repeated indices are often used to denote the summation of tensor components.
New pore nucleation primarily relies on the fracture or dislocation of second-phase particles or inclusions at the interface. The pore nucleation rule dominated by strain is given by
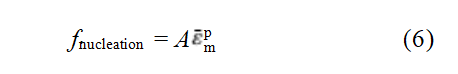
where: A is the pore nucleation coefficient, which is a function of the equivalent plastic strain of the matrix
and follows a normal distribution:
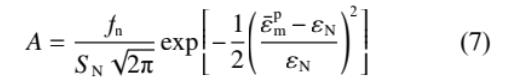
where: fn is the volume fraction of hole nucleation; εN is the average equivalent plastic strain during hole nucleation; SN is the standard deviation of the normal distribution;
3.2 Establishment of the Response Surface Model
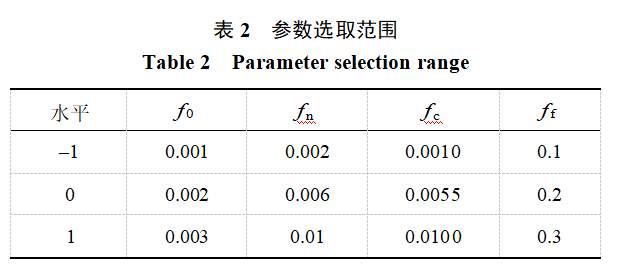
In this section, the response surface method is employed based on a central composite design to derive polynomial models describing the relationships between various factors and the response variable, and optimal parameters are calculated using experimental results as the objective. There are 9 parameters to be determined in the GTN damage model, namely: f0, fn, fc, ff, q1, q2, q3, SN, and εN. Among these, q1, q2, and q3 are correction coefficients related to material properties, which can be determined empirically. According to Reference [31], q1 = 1.5, q2 = 1.0, q3 = 2.25, and SN = 0.1. The remaining four damage parameters—initial porosity f0, pore nucleation volume fraction fn, critical pore volume fraction fc, and fracture pore volume fraction ff—are primarily determined using the response surface method. The parameter ranges selected based on Reference [30] are shown in Table 2.
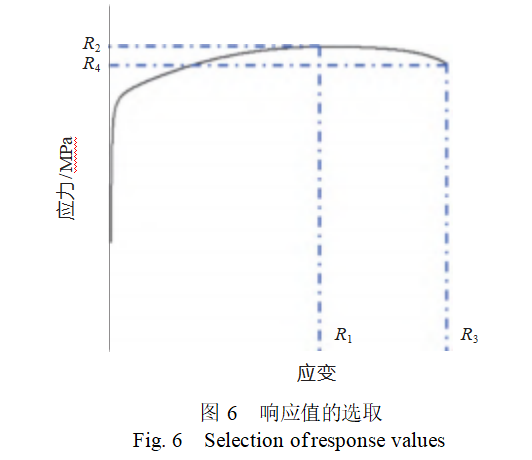
The two points—the maximum stress point and the fracture point—on the stress-strain curve are considered as characteristic points of the stress-strain curve. The four key values of the characteristic points on the stress-strain curve—the maximum strain R1, the maximum stress R2, the fracture strain R3, and the fracture stress R4—are used as response values, as shown in Figure 6. The four influencing factors are f0, fn, fc, and ff. In Design-Expert software, a four-factor three-level central composite design method was used to design 28 sets of uniaxial tensile simulation conditions.
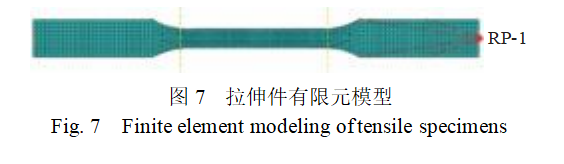
Finite element simulation of the uniaxial tensile test was performed using Abaqus/Explicit. The geometric dimensions of the specimen were consistent with the actual test dimensions, and the finite element model is shown in Figure 7. In the simulation, C3D8R eight-node linear hexahedral elements were selected. To improve simulation accuracy, the mesh in the intermediate tensile section was refined to a mesh size of 0.5 mm. The mesh size on the left and right fixed surfaces of the specimen was 1 mm. Transition meshes were set between the two different mesh sizes to ensure smooth mesh transition. The total number of mesh elements in the entire model is 6,400. To apply loads and boundary conditions, reference points were set at both ends of the specimen, and these reference points were coupled with the surfaces at both ends of the specimen. The reference point at the left end of the specimen was set to a fully fixed boundary condition, while the reference point at the right end (RP-1) was subjected to a displacement load.
3.3 RSM Model Parameter Calibration
In the 28 test conditions, the corresponding variables from each stress-strain curve were extracted, with the statistical results shown in Table 3. Second- and third-order polynomial regression models were used to analyze the response variables: peak strain R1, peak stress R2, fracture strain R3, and fracture stress R4.
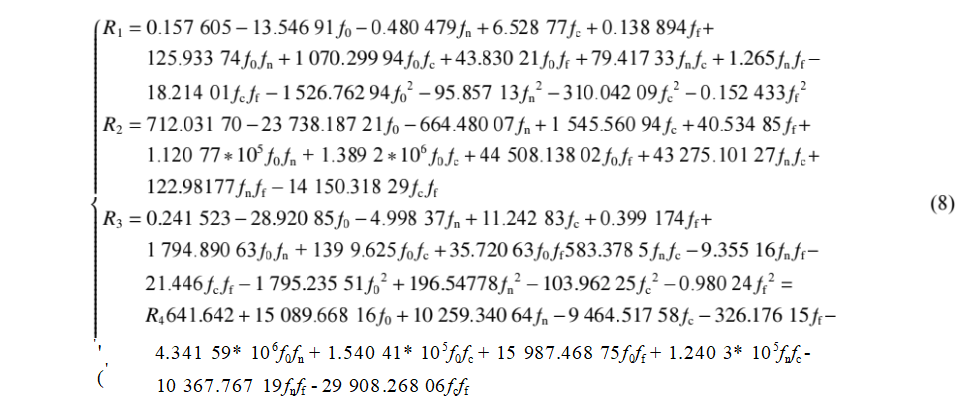
The results of the response surface model analysis indicate that the model significance level is <0.001, indicating that the model is statistically significant. The multiple correlation coefficient R² > 0.95, indicating that the model has good data fitting performance. After assessing the significance of each factor in the model, terms that were not significant for the response variables were removed from the regression model. The resulting coded regression equation is as follows:

By comparing the coefficients of each factor in the coded equation, their relative influences can be assessed. Among them, high levels are positive values, and low levels are negative values. Through analysis, it can be seen that among the four influencing factors, fc and ff have a significant impact on the tensile stress-strain curve, while f0 and fn have a minor impact on the tensile stress-strain curve.
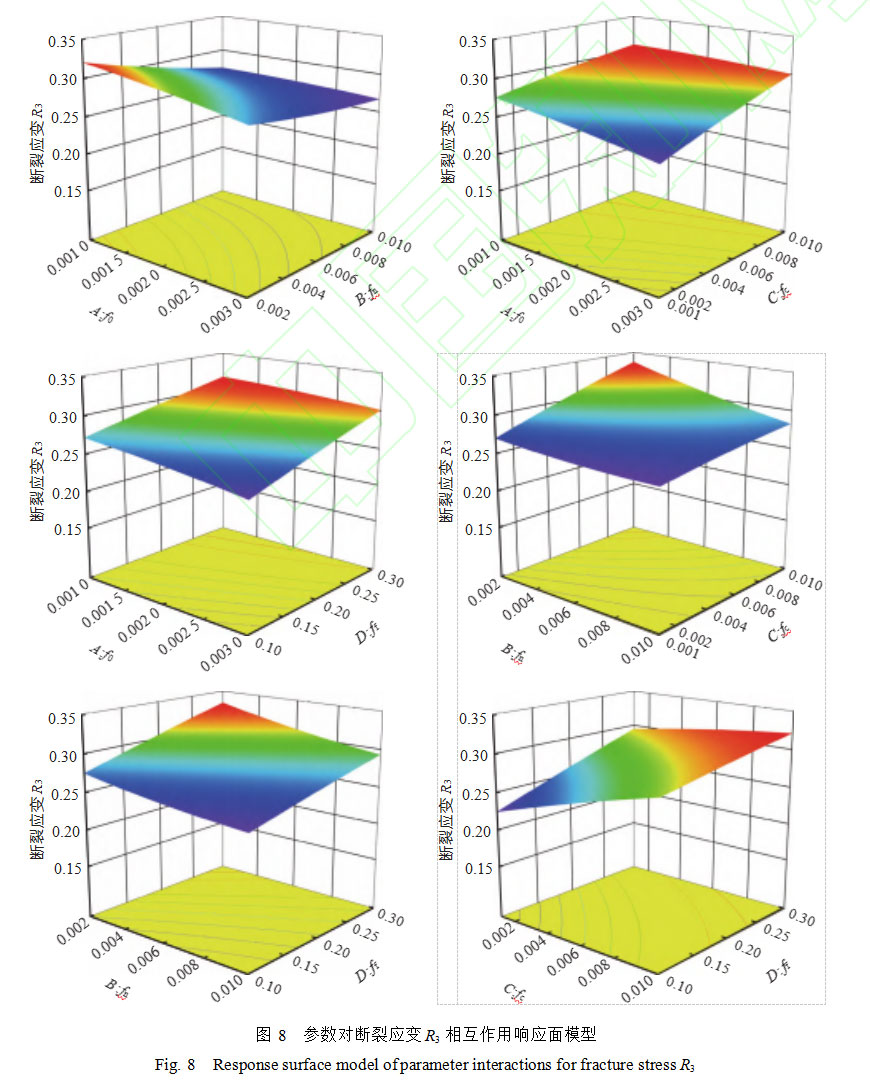
Figure 8 illustrates the relationship between the tensile fracture point strain (R3) and various parameters. The response surface curve provides an intuitive representation of the relationship between the variables and each parameter. Additionally, by observing the response surface curve, the following characteristics of the influence trend of parameters on the tensile fracture point strain (R3) can be identified: as fc increases, the strain at material fracture increases. The reason lies in the fact that fc determines the volume fraction of pore coalescence within the material. During pore coalescence, the pore volume fraction (VVF) increases to the value of ff. Meanwhile, as fn increases, fracture occurs at a lower strain. This indicates that an increase in the volume fraction of pore nucleation leads to a rapid growth in VVF.
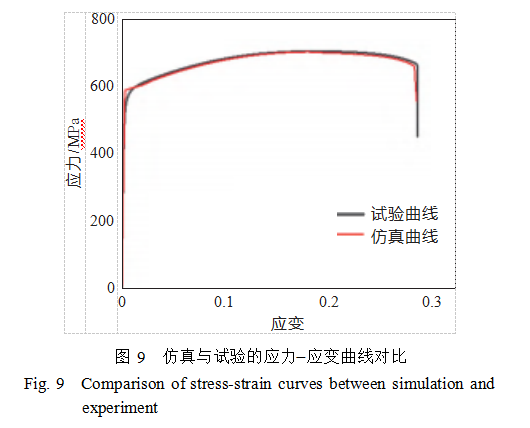
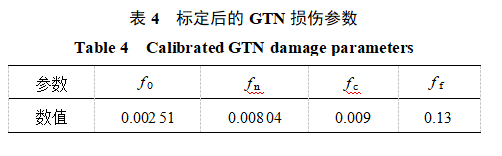
The characteristic points in the tensile test stress-strain curve (maximum strain R1, maximum stress R2) and the fracture point (fracture strain R3, fracture stress R4) are used as optimization targets. Through software optimization calculations, GTN damage parameters applicable to 316L steel material were obtained. Specific parameters are shown in Table 4. Using the calibrated damage parameters, tensile numerical simulations were performed on 316L steel material, and the numerical simulation results were compared with the force-displacement curves obtained from experiments, as shown in Figure 9. As can be seen from the figure, the simulation results show good consistency with the experimental results, indicating that the calibrated GTN damage model can effectively predict the mechanical properties of 316L steel material produced by SLM additive manufacturing.
4 Influence of Pore Defects on Structural Mechanical Properties
4.1 CT Scan Image of Tensile Specimen
SLM-processed models often contain internal defects such as pores. To visually observe pore distribution, CT scanning technology was used to inspect the tensile specimen. Cumulative tomographic images were captured to identify cavities in the specimen, as shown in Figure 10. From the CT scan results, it can be seen that the entire model contains porosity defects, and the porosity distribution is relatively uniform.
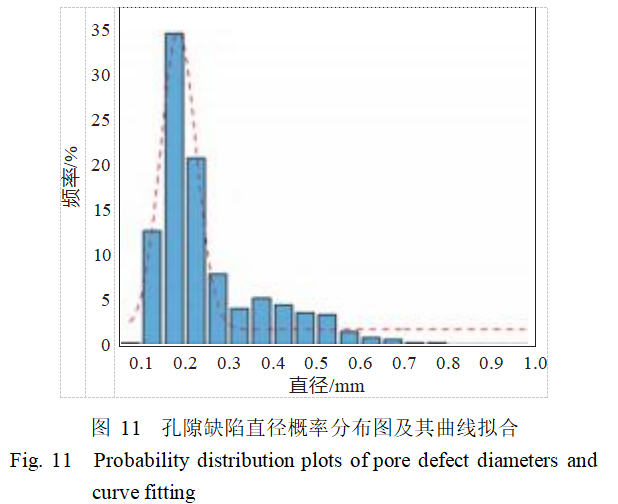
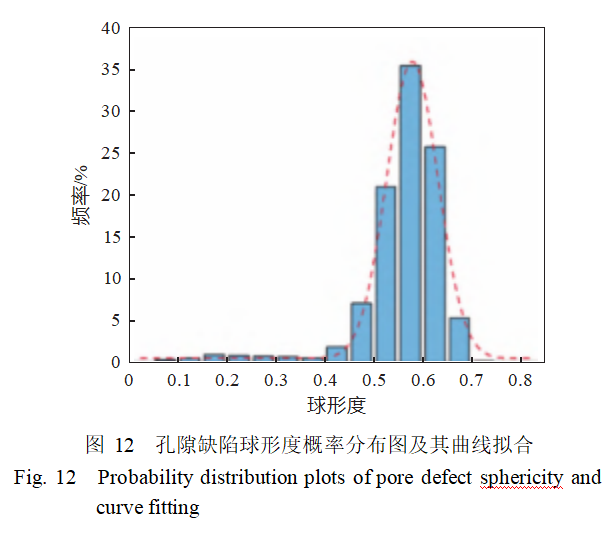
In the SLM process, the melting and solidification of metal materials occur extremely rapidly, leaving insufficient time for gases within the melt pool to escape to the surface, thereby forming gas pores within the melt pool. By analyzing the internal defects of the specimen, statistical data including defect size, distribution, and morphology can be extracted. Combining CT reconstruction and cavity statistics, it was found that although the shapes of the cavities vary, sphericity primarily ranges between 0.5 and 0.65, with pore diameters generally less than 1 mm. The highest number of pores has diameters between 0.15 and 0.2 mm, accounting for 34.63% of the diameter range, as shown in Figure 11.
Additionally, pore defects with sphericity between 0.5 and 0.7 account for approximately 87.141%, with the highest number of pores having sphericity between 0.55 and 0.6, representing 35.375% of the diameter range, as shown in Figure 12.
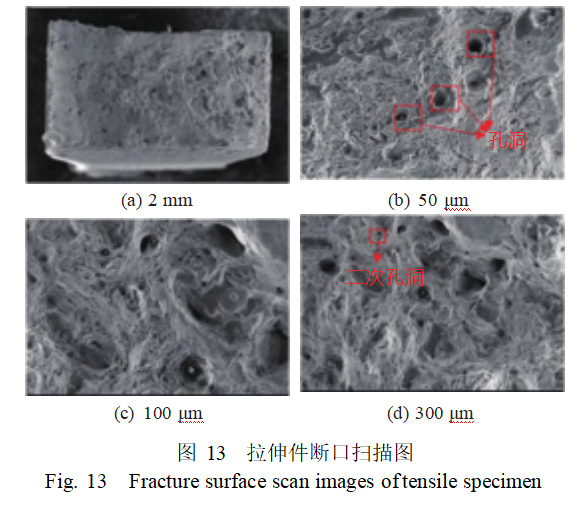
Figure 13 shows the scanning electron microscope (SEM) images of the fracture surface of the tensile specimen. These images reveal the presence of pore defects within the structure, which can adversely affect the material's mechanical properties. Additionally, ductile pits are observed on the fracture surface, indicating that the specimen underwent ductile fracture. Smaller pores, known as secondary pores, are also present around the primary pores. Secondary pores form on the shear bands around the initial pores and are typically located near small particles. They accelerate the aggregation and penetration of pores, ultimately leading to complete fracture and separation of the specimen.
4.2 Influence of Pore Defects on Failure Behavior
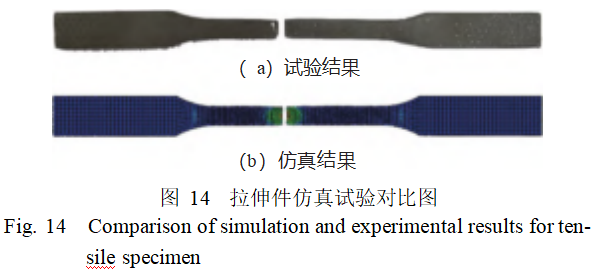
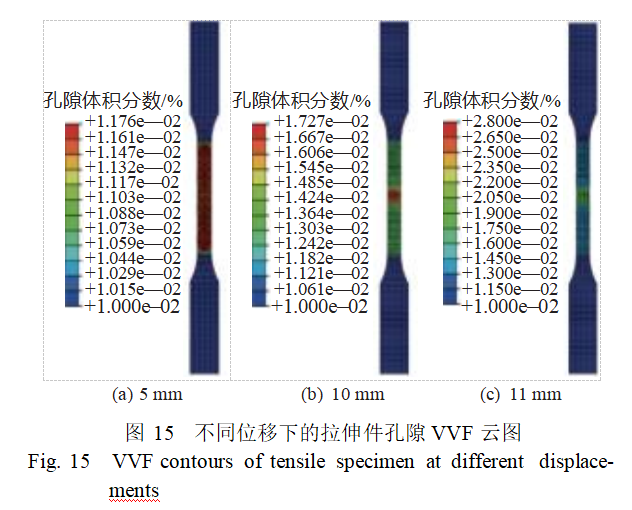
Simulation calculations were conducted using the calibrated GTN model parameters for tensile specimens. Figure 14 compares the tensile test results with the simulation results, showing that the fracture locations are well aligned, indicating that the GTN damage model can effectively predict structural fracture damage, and the damage parameters are applicable to SLM-processed 316L tensile specimens. Figure 15 shows the evolution of the VVF distribution during the compression fracture process of a uniaxial tensile specimen. According to the pore volume fraction cloud map of the specimen, when the tensile displacement is 5 mm, the pore volume fraction of the specimen is 0.0117, indicating a small pore volume fraction. The specimen is in the uniform deformation stage, with the pore volume fraction distributed uniformly across the tensile range and minimal damage accumulation. When the tensile displacement of the specimen reaches 10 mm, the pore volume fraction inside the specimen increases to 0.0172, and the pores inside the specimen begin to nucleate and grow rapidly, causing the pore volume fraction to increase. This is because pore aggregation causes the deformation of the specimen to gradually concentrate. When the tensile displacement of the specimen reaches 12.6 mm, the pore volume fraction inside the specimen increases to 0.028, and the pores inside the specimen begin to nucleate and grow rapidly, causing the pore volume fraction to increase rapidly. Pore aggregation causes the deformation of the specimen to gradually concentrate. Figure 16 shows the pore VVF cloud map of the compressed region of the tensile specimen. The pores first concentrate in the necked region, and this is particularly evident in the central region of the cross-section.
To improve computational efficiency, reduce computation time, and ensure computational accuracy, a mesh sensitivity analysis was performed on the grid-compressed finite element model. Numerical simulations were conducted using finite element models with mesh sizes of 2.0, 1.5, 1.25, 1.0, 0.75, and 0.5 mm, with the results shown in Figure 17. As shown in the figure, when the mesh size is less than 2 mm, the simulation results are relatively close. Considering both computational time and accuracy, a mesh size of 1.0 mm was ultimately selected for the finite element model.
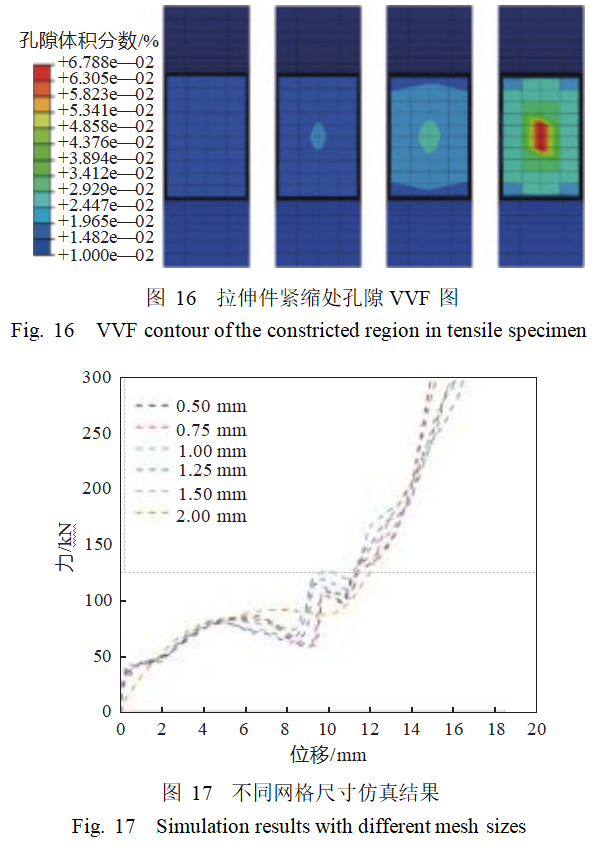
Figure 18 compares the force-displacement curve results from the lattice structure compression test and numerical simulations using models with and without pores. As shown in the figure, both simulation curves exhibit a trend where force first increases, then decreases, and subsequently increases again, which is consistent with the experimental results. Compared to the pore-free model, the simulation results of the porous model are closer to the experimental curve. Before the compression displacement reaches 0.075 mm, the differences between the porous and pore-free models are small. As the load continues to be applied, the force in the porous model gradually becomes smaller than that in the non-porous model, and the difference gradually increases. According to GTN theory, the reason for this phenomenon is that as deformation increases, local stress increases, and the VVF of pores also increases. When the pore volume fraction reaches the critical void fraction, pores begin to coalesce into large cavities, thereby exerting a greater influence on the mechanical properties of the structure. During the initial elastic stage, the smaller the porosity, the lesser the influence of internal pores on the material's isotropy. Figure 19 shows the von Mises equivalent stress and pore volume fraction distribution contour plots. As shown in the figure, during compression deformation, stress concentration occurs at the center of the cross-shaped base of the upper-layer cells, while pore nucleation also occurs in the same region, leading to increased susceptibility to failure damage.
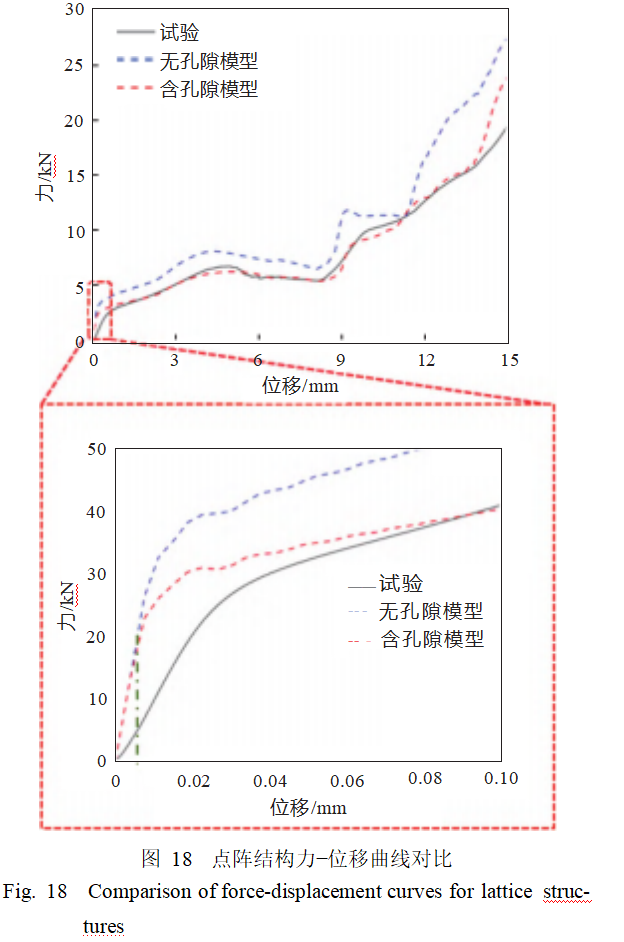
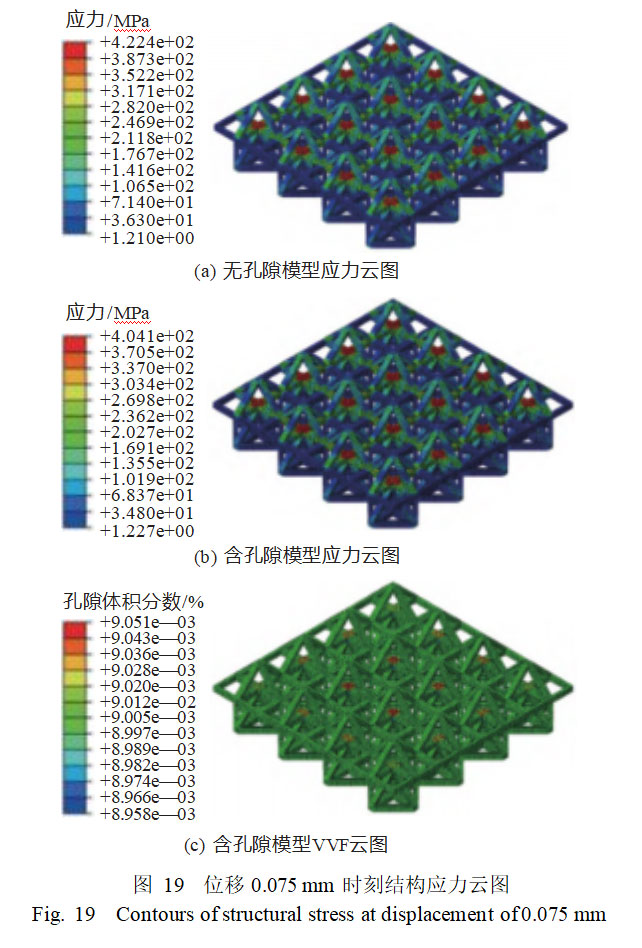
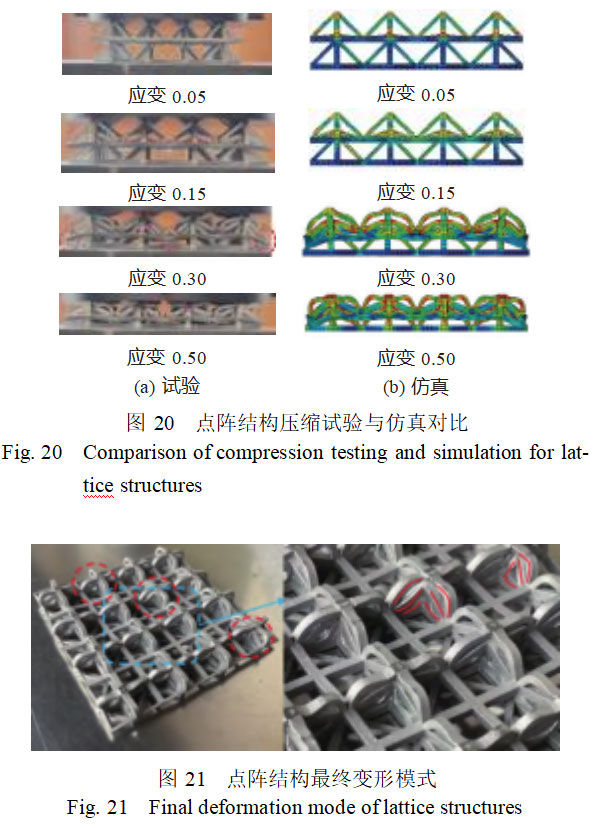
Figure 20 compares the deformation patterns of the lattice structure under different compressive strains in simulation and experimental results. When the strain reaches 0.05, the cross-shaped base of the upper cell unit begins to deform. When the strain increases to 0.15, the cross-shaped base of the upper cell unit undergoes bending deformation. When the strain further increases to 0.3, the bases of the left and right cells come into contact with the lower-layer cells, and the tops of the upper-layer cells come into contact with the lower-layer cells. When the strain reaches 0.5, the structure enters the dense zone, and the entire model is compressed. Under the same strain conditions, the experimental results are consistent with the simulation calculations. During compression, the structural deformation primarily occurs in the cell unit diagonal rods and cross-shaped bases, with overall deformation exhibiting a symmetrical pattern. The deformation processes of the middle two groups of cell units are similar, and those of the left and right groups are also similar. As shown in the highlighted portion of Figure 21, both the upper and lower cells of the lattice structure undergo significant bending deformation. The upper cell is compressed to contact the lower cell, and the base and diagonal rods of the upper cell undergo significant plastic deformation.
4.3 Influence of Pore Defects on Energy Absorption of Lattice Structures
For lattice structures, energy absorption (EA) is the primary indicator for evaluating their performance, which depends on relative density, structural geometry, and material properties. Energy absorption performance can be derived by integrating the area under the stress-strain curve obtained from compression deformation results. Specific energy absorption (SEA) represents the energy absorbed per unit mass, providing a more intuitive reflection of the energy absorption efficiency of lattice structures.
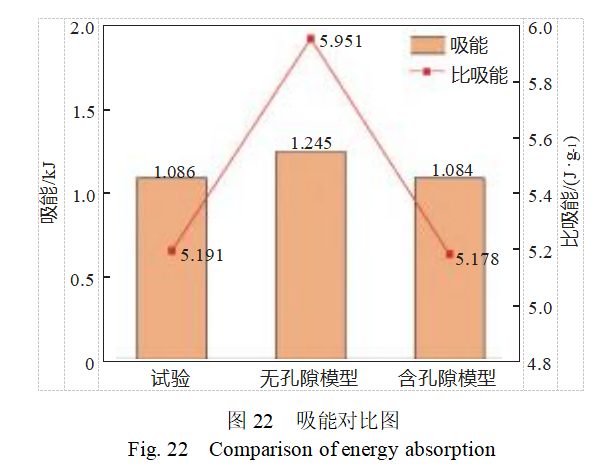
To investigate the predictive capability of the porous defect model for the energy absorption of the experimental model, Figure 22 shows a bar chart comparing the energy absorption of the experimental model, the non-porous model, and the porous defect model. The difference between the actual energy absorption and the theoretical value primarily stems from internal porous defects introduced by the manufacturing process. The non-porous model, which does not account for internal porous defects, exhibits the highest energy absorption and specific energy absorption; meanwhile, the energy absorption results of the porous defect model are closer to the experimental values. Comparisons of the three sets of conditions show that the energy absorption of the experimental, pore-free, and pore-containing models are 1.086, 1.245, and 1.084 kJ, respectively, and the specific energy absorption are 5.191, 5.951, and 5.178 J/g, respectively. The energy absorption error between the porous model and the experimental value is only 0.25%, while the error between the non-porous model and the experimental value is as high as 14.6%. This result indicates that the porous defect model can effectively predict the energy absorption capacity of defect-containing lattice structures.
4.4 Effect of Porosity on Energy Absorption of Lattice Structures
Quasi-static compression simulations were conducted for different porosities, with six lattice structures having porosities of 0.01%, 0.1%, 0.25%, 0.5%, 0.75%, and 1% calculated separately. The results are shown in Figure 23. Within the strain range of 0 to 0.1, the curves are relatively close, with stress increasing slowly with strain. This indicates that at low strain levels, materials with different porosities exhibit similar responses, and the material remains in the elastic deformation stage, with stress and strain approximately linear. Within the strain range of 0.1 to 0.4, the curves begin to diverge to some extent, and the trends in stress-strain changes show differences. As strain increases, the stress rise trend is not consistently stable and exhibits fluctuations. As porosity increases, the first peak stress gradually decreases. The initial peak stress of the pore-free model is 8.12 MPa, while that of the 1% porosity model is 5.92 MPa, a decrease of 27%. When the porosity is 0.01%, the quasi-static pressure curve is essentially consistent with that of the pore-free model, indicating that pores have a negligible effect on the structural mechanical properties at this porosity level.
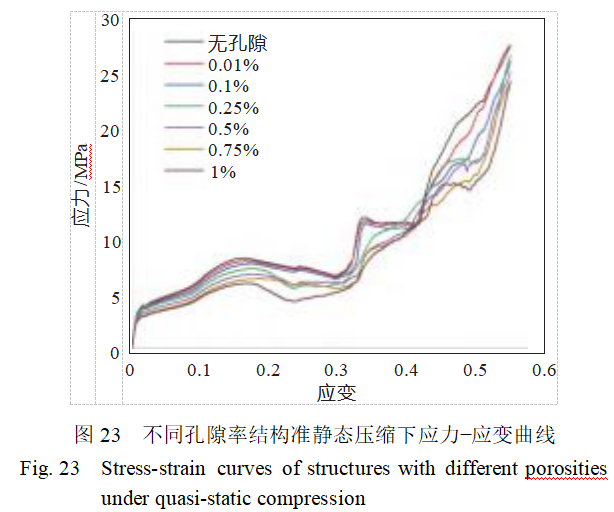
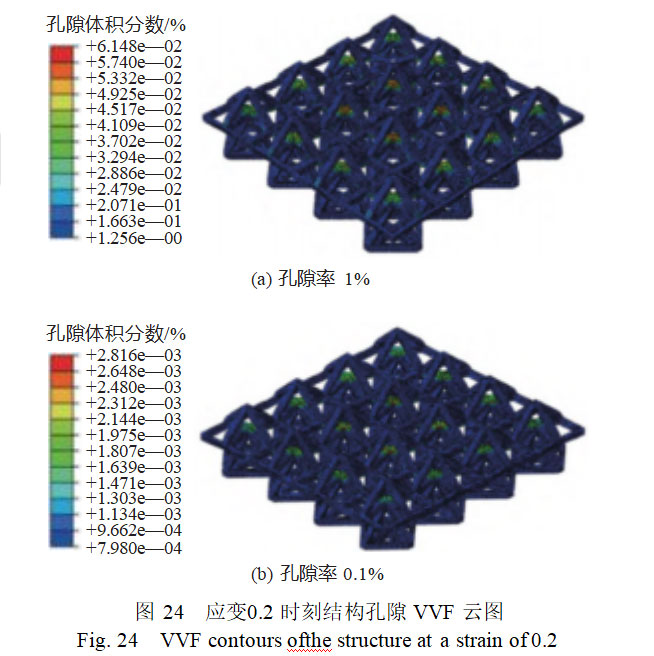
Figure 24 shows the pore VVF contour plots at a strain of 0.2 for pore volumes of 0.1% and 1%. Through comparative analysis, it can be observed that when the pore volume is 1%, the pore volume fraction within the structure is greater than in cases with lower pore volumes, leading to a decrease in stress during structural compression and a reduction in structural compression performance.
From the structural energy absorption comparison diagram, it can be seen that as the porosity increases, the structural energy absorption values are 1.245, 1.196, 1.147, 1.078, 0.984, 0.966, and 0.947 kJ, respectively. The corresponding decreases in structural energy absorption are 3.93%, 7.87%, 13.41%, 20.98%, 22.41%, and 23.94%, respectively, as shown in Figure 25. From the figure, it can be seen that as the porosity increases, the structural energy absorption decreases. When the porosity is 1%, the maximum decrease reaches 23.94%, further confirming the significant impact of porosity on the structural compression performance.
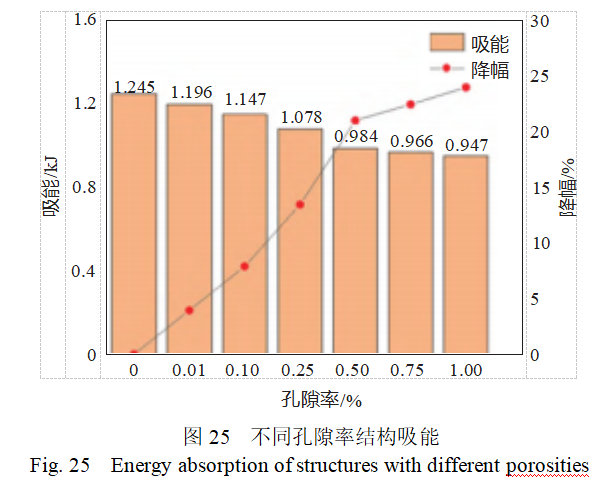
For protective structures, a decrease in structural energy absorption exceeding 20% can be considered a significant issue. When the porosity exceeds 0.5%, the decrease in structural energy absorption is greater than 20%. Therefore, to ensure the mechanical performance of protective lattice structures, it is best to control the internal porosity during processing to within 0.5%. To mitigate the impact of porosity on lattice structure compression performance, during initial structural design, locations prone to shadow effects, such as sharp angles and narrow slots, should be avoided. When necessary, process radii can be added to reduce porosity generation during processing, thereby enhancing the model's compression performance.
5 Conclusions
In this study, 316L steel tensile specimens and lattice structures were fabricated using the SLM additive manufacturing method. Material mechanical tensile tests and lattice quasi-static compression tests were conducted. Response surface methodology was used to calibrate material damage parameters, and studies were conducted on the deformation modes and energy absorption characteristics of lattice structures under quasi-static compression. The main conclusions are as follows:
1) The GTN damage parameters of 316L steel were calibrated using a response surface model, with the maximum stress point and fracture strain point of the experimental stress-strain curve as targets. The calibrated damage parameters accurately predicted the fracture damage and damage evolution of specimens with pore defects.
2) Internal pore defects generated during additive manufacturing affect the mechanical properties of the structure. During compression of lattice structures with pore defects, pores first coalesce into large cavities in stress concentration regions, thereby reducing the strength, load-bearing capacity, and energy absorption capacity of the lattice structure.
3) The porous defect model effectively describes the compression failure process of lattice structures and predicts their energy absorption. Considering the influence of internal pores in lattice structures, the energy absorption of the porous model and the experimental model are 1.084 and 1.086 kJ, respectively, with a difference of 0.25%.
4) As porosity increases, stress during structural compression decreases, energy absorption reduces, and compression performance weakens. When porosity reaches 1%, the structural energy absorption is 947 J, a 23% reduction compared to the pore-free model, significantly affecting the structural compression performance.
References: “Study on the Influence of Pore Defects on the Compression Behavior of 3D-Printed Lattice Structures,” first published online in “Chinese Ship Research.”
Xingchen Technology specializes in the research, development, and production of spherical powders made from rare refractory metals. Our products feature high purity, low oxygen content, and excellent sphericity, and we also offer customized services for parameters such as particle size and composition. Leveraging advanced powder preparation technology, we provide customers with comprehensive solutions for additive manufacturing (3D printing), covering all stages from material development and process optimization to finished product processing. We are committed to technological innovation and quality control, dedicated to providing professional and reliable powder materials and additive manufacturing services to clients in the aerospace, medical devices, and precision molds industries. For inquiries, please contact Cathie Zheng at +86 13318326187.


Signup our newsletter to get update information, promotion and insight.


 IPv6 network supported